Geometry computations Example 1: Movement key-point statistics in grid-system
In this notebook, we:
Divide the experimental arena into distinct geometrical regions.
Compute and visualize the time the animal spends in each region of the arena.
This analysis can be used to study spatial preferences in the experimental arena. This analysis is based on the location of a pose-estimated key-point. To perform the analysis using the animal hull, see THIS notebook.
[1]:
import numpy as np
import os
import cv2
from simba.mixins.geometry_mixin import GeometryMixin
from simba.mixins.config_reader import ConfigReader
from simba.utils.read_write import read_df, read_frm_of_video
from simba.mixins.plotting_mixin import PlottingMixin
import matplotlib.pyplot as plt
import matplotlib
dpi = matplotlib.rcParams['figure.dpi']
[2]:
# DEFINE PROJECT AND VIDEO NAME

PROJECT_PATH = r'/Users/simon/Desktop/envs/troubleshooting/Rat_NOR/project_folder/project_config.ini'
VIDEO_NAME = '2022-06-20_NOB_DOT_4'
BP = 'Nose' # THE BODY-PART WE WILL USE TO INFER POSITION OF ANIMAL
[3]:
# READ IN THE DATA, VIDEO SIZE, FPS, AND PIXEL CONVERSION FACTOR.
config = ConfigReader(config_path=PROJECT_PATH, create_logger=False)
video_info, px_per_mm, fps = config.read_video_info(video_name=VIDEO_NAME)
width, height = int(video_info['Resolution_width'].values[0]), int(video_info['Resolution_height'].values[0])
bp = [f'{BP}_x', f'{BP}_y']
data_path = os.path.join(config.outlier_corrected_dir, VIDEO_NAME + f'.{config.file_type}')
data = read_df(file_path=data_path, usecols=bp, file_type=config.file_type)
[4]:
# WE CREATE A SQUARE GEOMETRY GRID WHICH IS 5 BY 5 LARGE TO COVER THE EXPERIMENTAL ARENA
GRID_SIZE = (5, 5) # THE SIXE OF THE GRID WE WILL CREATE
grid, aspect_ratio = GeometryMixin().bucket_img_into_grid_square(img_size=(width, height), bucket_grid_size=GRID_SIZE, px_per_mm=px_per_mm)
SIMBA COMPLETE: Bucket image into grid squares complete (elapsed time: 0.0004s) complete
[5]:
# WE VISUALIZE THE GRID AS A SANITY CHECK
video_path = r'/Users/simon/Desktop/envs/troubleshooting/Rat_NOR/project_folder/videos/2022-06-20_NOB_DOT_4.mp4'
video_frm = read_frm_of_video(video_path=video_path, frame_index=0, opacity=30)
img = GeometryMixin().view_shapes(shapes=list(grid.values()), bg_img=video_frm)
height, width, depth = img.shape
figsize = width / float(dpi), height / float(dpi)

plt.figure(figsize=figsize)
plt.axis('off')
plt.imshow(img)
plt.show()

[6]:
# ALTERNATIVE: IF YOU PREFER HEXAGONAL GRID, USE simba.mixins.geometry_mixins.GeometryMixin.bucket_img_into_grid_hexagon()
hex_grid, aspect_ratio = GeometryMixin().bucket_img_into_grid_hexagon(img_size=(width, height), bucket_size_mm=20, px_per_mm=px_per_mm)
video_frm = read_frm_of_video(video_path=video_path, frame_index=0, opacity=30)
img = GeometryMixin().view_shapes(shapes=list(hex_grid.values()), bg_img=video_frm)

plt.figure(figsize=figsize)
plt.axis('off')
plt.imshow(img)
plt.show()
SIMBA COMPLETE: Bucket image into hexagon grid complete (elapsed time: 0.0059s) complete

[7]:
# ALTERNATIVE: IF YOU PREFER TRIANGULATES GRID, USE simba.mixins.geometry_mixins.GeometryMixin.delaunay_triangulate_keypoints()
grid_points = GeometryMixin().bucket_img_into_grid_points(point_distance=100, px_per_mm=px_per_mm, img_size=(width, height), border_sites= False)
grid_point_locations = np.full((len(list(grid_points.keys()), ), 2), np.nan)
for cnt, (k, v) in enumerate(grid_points.items()): grid_point_locations[cnt] = np.array(v)
delaunay_grid = GeometryMixin().delaunay_triangulate_keypoints(data=grid_point_locations)

video_frm = read_frm_of_video(video_path=video_path, frame_index=0, opacity=10)
img = GeometryMixin().view_shapes(shapes=delaunay_grid, bg_img=video_frm)

plt.figure(figsize=figsize)
plt.axis('off')
plt.imshow(img)
plt.show()
SIMBA COMPLETE: Bucket image into grid points complete (elapsed time: 0.0089s) complete

[8]:
# WE CALCULATE THE CUMULATIVE TIME THE ANIMAL SPENDS IN EACH GEOMETRY
time_data = GeometryMixin().cumsum_coord_geometries(data=data.values, geometries=grid, fps=fps, verbose=False)
SIMBA COMPLETE: Cumulative coordinates in geometries complete (elapsed time: 5.0678s) complete
[9]:
#THIS RETURNS A 3D ARRAY, WHERE THE LAST 2D ARRAY CORRESPONDS WITH THE CUMULATIVE TIME THE ANIMAL HAS SPENT IN
#EACH GEOMETRY AT THE END OF THE VIDEO.

#EACH 2D ARRAY REPRESENTS THE CUMULATIVE TIME THE ANIMAL HAS SPENT IN EACH GEOMETRY UP UNTIL AND INCLUDING THAT FRMAE,
#AND THE ARRAY WILL BE LEN(VIDEO FRAMES) X VERTICAL SHAPES X HORIXONTAL SHAPES.
time_data[-1]
[9]:
array([[11.36666667, 26.93333333, 41.06666667,  7.86666667,  5.46666667],
       [ 7.16666667, 14.53333333, 27.7       ,  6.86666667,  8.86666667],
       [18.96666667, 19.46666667, 25.16666667,  2.06666667, 11.4       ],
       [ 0.76666667,  2.26666667,  1.5       ,  0.        ,  3.26666667],
       [ 7.83333333, 17.83333333, 14.9       ,  9.2       ,  7.53333333]])
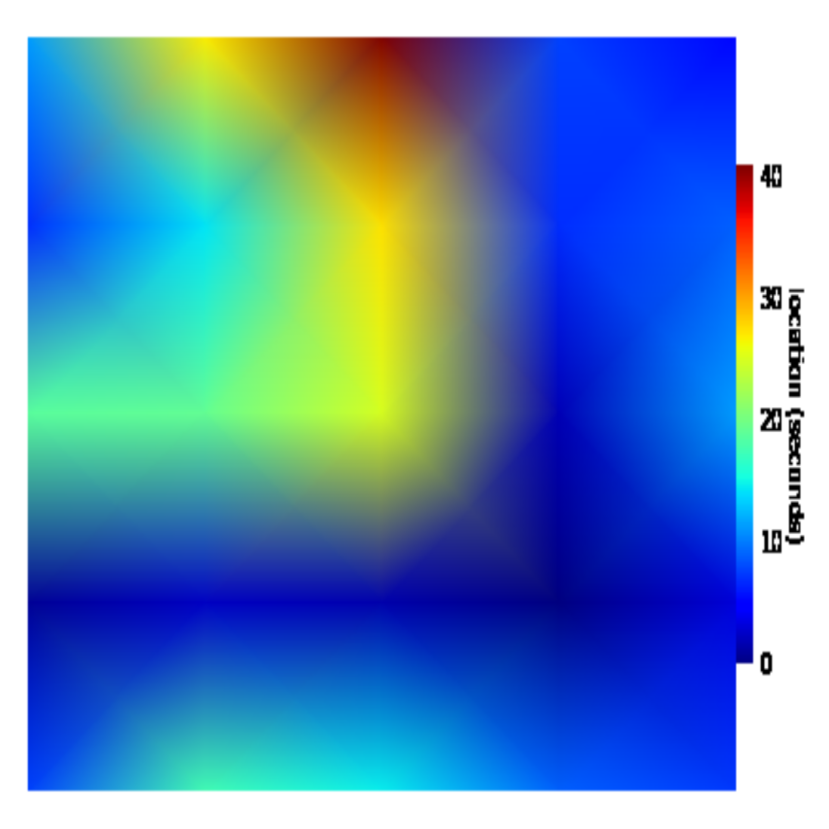
[10]:
#TO PLOT A HEATMAP REPRESENTING THE GRID LOCATIONS OF THE ANIMAL IN THE VIDEO, USE
# simba.mixins.plotting_mixin.PlottingMixin.make_location_heatmap_plot()

img = PlottingMixin().make_location_heatmap_plot(frm_data=time_data[-1],
                                                 max_scale=np.max(time_data[-1]),
                                                 palette='jet',
                                                 shading='gouraud',
                                                 img_size=(width, height),
                                                 aspect_ratio=aspect_ratio)

img = cv2.cvtColor(img, cv2.COLOR_BGR2RGB)

height, width, depth = img.shape
figsize = width / float(dpi), height / float(dpi)

plt.figure(figsize=figsize)
plt.axis('off')
plt.imshow(img)
plt.show()
[11]:
# ALTERNATIVE EXAMPLE USING FLAT AND MAGMA SETTINGS
img = PlottingMixin().make_location_heatmap_plot(frm_data=time_data[-1],
                                                 max_scale=np.max(time_data[-1]),
                                                 palette='magma',
                                                 shading='flat',
                                                 img_size=(width, height),
                                                 aspect_ratio=aspect_ratio)

img = cv2.cvtColor(img, cv2.COLOR_BGR2RGB)

height, width, depth = img.shape
figsize = width / float(dpi), height / float(dpi)

plt.figure(figsize=figsize)
plt.axis('off')
plt.imshow(img)
plt.show()
