Plotting and visualization tools
On this page
Direction between animals
- class simba.plotting.directing_animals_visualizer.DirectingOtherAnimalsVisualizer(config_path, video_path, style_attr, left_ear_name=None, right_ear_name=None, nose_name=None)[source]
Bases:
simba.mixins.config_reader.ConfigReader,simba.mixins.plotting_mixin.PlottingMixinCreate videos visualizing when animals direct their gaze toward body parts of other animals (single-threaded).
Draws directional lines from eye positions (calculated from nose and ear coordinates) to target body parts. For faster processing of large videos, use
DirectingOtherAnimalsVisualizerMultiprocess.Important
Requires pose-estimation data for left ear, right ear, and nose of each animal. Project must contain at least 2 animals.
Note


See also
For improved runtime, consider multiprocess class at
simba.plotting.directing_animals_visualizer_mp.DirectingOtherAnimalsVisualizerMultiprocess().- Parameters
config_path (Union[str, os.PathLike]) – Path to SimBA project config file.
video_path (Union[str, os.PathLike]) – Path to video file. Corresponding data file must exist in outlier_corrected_movement_location directory.
style_attr (Dict[str, Any]) – Video style attributes with required keys: ‘show_pose’ (bool), ‘animal_names’ (bool), ‘circle_size’ (int or None), ‘directionality_color’ (RGB tuple, list of tuples, or ‘Random’), ‘direction_thickness’ (int or None), ‘highlight_endpoints’ (bool).
left_ear_name (Optional[str]) – Left ear body part name. If None, auto-detected. Must provide all three body part names or none.
right_ear_name (Optional[str]) – Right ear body part name. If None, auto-detected.
nose_name (Optional[str]) – Nose body part name. If None, auto-detected.
- Raises
AnimalNumberError – If project contains fewer than 2 animals.
NoFilesFoundError – If pose-estimation data file not found.
InvalidInputError – If body part names partially provided.
- Example
>>> style_attr = {'show_pose': True, 'animal_names': True, 'circle_size': 3, 'directionality_color': [(255, 0, 0), (0, 0, 255)], 'direction_thickness': 10, 'highlight_endpoints': True}
>>> visualizer = DirectingOtherAnimalsVisualizer(config_path='project_config.ini', video_path='video.avi', style_attr=style_attr)
>>> visualizer.run()
Direction between animals - multiprocess
- class simba.plotting.directing_animals_visualizer_mp.DirectingOtherAnimalsVisualizerMultiprocess(config_path, video_path, style_attr, core_cnt=- 1, time_slice=None, left_ear_name=None, line_opacity=1.0, right_ear_name=None, nose_name=None)[source]
Bases:
simba.mixins.config_reader.ConfigReader,simba.mixins.plotting_mixin.PlottingMixinCreate videos visualizing when animals direct their gaze toward body parts of other animals using multiprocessing.
Draws directional lines from eye positions (calculated from nose and ear coordinates) to target body parts. Uses parallel processing across CPU cores for faster video creation.
Important
Requires pose-estimation data for left ear, right ear, and nose of each animal. Project must contain at least 2 animals.
Note
See also
For single core function, see
simba.plotting.directing_animals_visualizer.DirectingOtherAnimalsVisualizer().- Parameters
config_path (Union[str, os.PathLike]) – Path to SimBA project config file.
video_path (Union[str, os.PathLike]) – Path to video file. Corresponding pose data must exist in outlier_corrected_movement_location directory.
style_attr (Dict[str, Any]) – Style attributes with keys: ‘show_pose’, ‘animal_names’, ‘circle_size’, ‘directionality_color’, ‘direction_thickness’, ‘highlight_endpoints’. See example.
core_cnt (Optional[int]) – Number of CPU cores. -1 = all available. Default -1.
time_slice (Optional[Dict[str, str]]) – If set, restrict to time period. Dict with keys ‘start_time’ and ‘end_time’ (HH:MM:SS). Default None.
left_ear_name (Optional[str]) – Left ear body-part name. If None, auto-detected. Must provide all three body parts or none.
right_ear_name (Optional[str]) – Right ear body-part name. If None, auto-detected.
nose_name (Optional[str]) – Nose body-part name. If None, auto-detected.
line_opacity (float) – Opacity of direction lines (0.0–1.0). Default 1.0.
- Raises
AnimalNumberError – If project contains fewer than 2 animals.
NoFilesFoundError – If pose-estimation data file not found.
InvalidInputError – If body part names partially provided.
- Example
>>> style_attr = {'show_pose': True, 'animal_names': False, 'circle_size': 3, 'directionality_color': [(255, 0, 0), (0, 0, 255)], 'direction_thickness': None, 'highlight_endpoints': True}
>>> visualizer = DirectingOtherAnimalsVisualizerMultiprocess(config_path='project_config.ini', video_path='video.avi', style_attr=style_attr, core_cnt=-1)
>>> visualizer.run()
ROI feature visualization
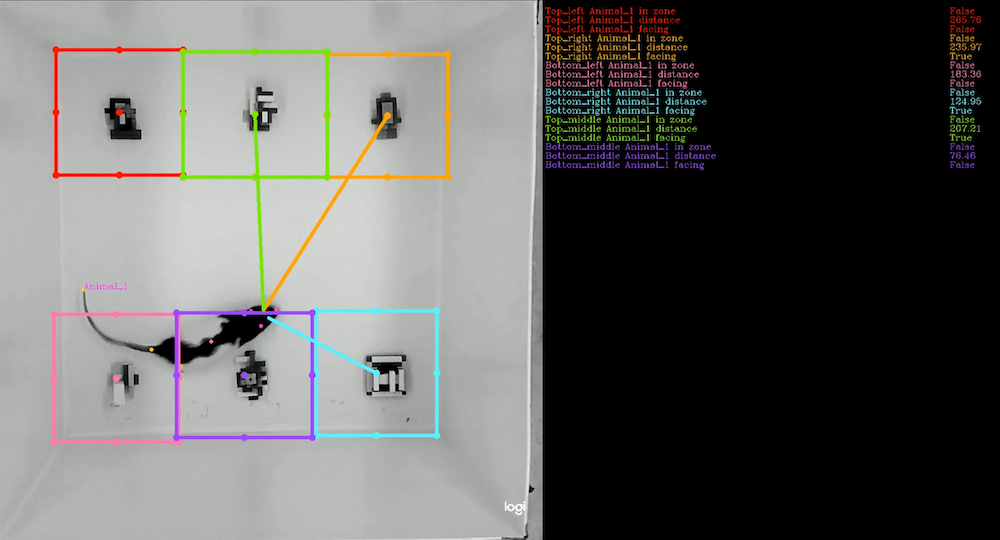
- class simba.plotting.ROI_feature_visualizer.ROIfeatureVisualizer(config_path, video_path, body_parts, style_attr)[source]
Bases:
simba.mixins.config_reader.ConfigReaderVisualizing features that depend on the relationships between the location of the animals and user-defined ROIs. E.g., distances to centroids of ROIs, if animals are directing towards ROIs, and if animals are within ROIs.
Note
For improved run-time, see
simba.ROI_feature_visualizer_mp.ROIfeatureVisualizerMultiprocess()for multiprocess class. Tutorials.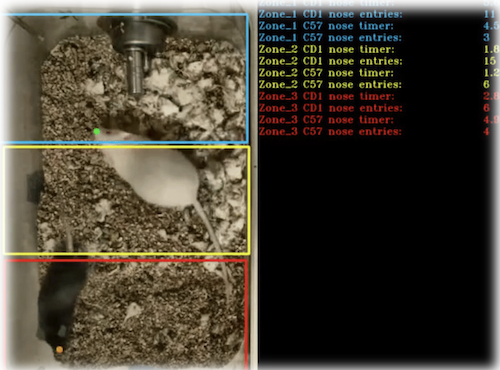

- Parameters
config_path (Union[str, os.PathLike]) – Path to SimBA project config file in Configparser format
video_path (Union[str, os.PathLike]) – Path to video file to overlay ROI features on.
body_parts (List[str]) – List of body-parts to use as proxy for animal location(s).
style_attr (Dict[str, Any]) – User-defined styles (sizes, colors etc.)
- Example
>>> style_attr = {'roi_centers': True, 'roi_ear_tags': True, 'directionality': True, 'directionality_style': 'funnel', 'border_color': (0, 0, 0), 'pose_estimation': True, 'animal_names': True}
>>> test = ROIfeatureVisualizer(config_path='/Users/simon/Desktop/envs/simba/troubleshooting/RAT_NOR/project_folder/project_config.ini', video_path='/Users/simon/Desktop/envs/simba/troubleshooting/RAT_NOR/project_folder/videos/2022-06-20_NOB_DOT_4.mp4', style_attr=style_attr, body_parts=['Nose'])
>>> test.run()
ROI feature visualization - multiprocess
- class simba.plotting.ROI_feature_visualizer_mp.ROIfeatureVisualizerMultiprocess(config_path, video_path, body_parts, show_roi_centers=True, show_roi_eartags=False, show_animal_names=False, font=None, border_bg_clr=(0, 0, 0), direction=None, time_slice=None, bbox=None, roi_coordinates_path=None, show_pose=True, core_cnt=- 1, gpu=False)[source]
Bases:
simba.mixins.config_reader.ConfigReaderVisualize features that depend on the relationships between the location of the animals and user-defined ROIs. E.g., distances to centroids of ROIs, cumulative time spent in ROIs, if animals are directing towards ROIs etc. Uses multiprocessing for faster rendering.
- Parameters
config_path (Union[str, os.PathLike]) – Path to SimBA project config file in Configparser format.
video_path (Union[str, os.PathLike]) – Path to video file to overlay ROI features on.
body_parts (List[str]) – List of body-parts to use as proxy for animal location(s). One per animal.
show_roi_centers (bool) – If True, draw the center point of each ROI on the video. Default True.
show_roi_eartags (bool) – If True, draw ear-tag labels on ROI shapes. Default False.
show_animal_names (bool) – If True, display animal names on the video. Default False.
font (Optional[str]) – Name of a SimBA-bundled font (in
simba/assets/fonts, e.g.'Poppins Regular') used for the ROI feature text drawn in the border panel. If None, a default cv2 font is used. Default None.border_bg_clr (Tuple[int, int, int]) – RGB tuple for the background color of the border panel where ROI stats are shown. Default (0, 0, 0).
direction (Optional[Literal['funnel', 'lines']]) – If not None, draw directionality (animal directing towards ROI).
'funnel'or'lines'style. Default None (no directionality).time_slice (Optional[Dict[str, str]]) – Optional time window to render, given as
{'start_time': 'HH:MM:SS', 'end_time': 'HH:MM:SS'}. If None, the full video is rendered. Default None.bbox (Optional[Literal['axis-aligned', 'animal-aligned']]) – If not None, draw bounding boxes around each animal.
'axis-aligned'= rectangle aligned with video axes;'animal-aligned'= minimum rotated rectangle. Default None (no bounding boxes).roi_coordinates_path (Optional[Union[str, os.PathLike]]) – Optional path to ROI definitions file. If None, uses project default from config. Default None.
show_pose (bool) – If True, draw pose-estimation keypoints (circles) on the video. Default True.
core_cnt (int) – Number of CPU cores for multiprocessing. -1 uses all available. Default -1.
gpu (bool) – If True, use GPU for video concatenation when available. Default False.
Note
Tutorials. See
simba.ROI_feature_visualizer.ROIfeatureVisualizer()for single process class. Would be slower but potentially more reliable.
- Example
>>> test = ROIfeatureVisualizerMultiprocess(config_path='/Users/simon/Desktop/envs/simba/troubleshooting/spontenous_alternation/project_folder/project_config.ini',
...     video_path='/Users/simon/Desktop/envs/simba/troubleshooting/spontenous_alternation/project_folder/videos/NOR ENCODING FExMP8.mp4',
...     body_parts=['Center'],
...     show_roi_centers=True,
...     show_roi_eartags=False,
...     direction='funnel',
...     show_pose=True,
...     show_animal_names=True,
...     font='Poppins Regular',
...     core_cnt=-1)
>>> test.run()
ROI directing visualization
- class simba.plotting.roi_directing_visualizer.DirectingROIVisualizer(config_path, video_path, direction_style='lines', direction_color=(0, 0, 255), direction_thickness=None, circle_size=None, show_pose=True, show_roi_centers=True, show_animal_names=False, border_bg_clr=(0, 0, 0), time_slice=None, roi_coordinates_path=None, left_ear_name=None, right_ear_name=None, nose_name=None, core_cnt=- 1, gpu=False, verbose=True)[source]
Bases:
simba.mixins.config_reader.ConfigReader,simba.mixins.plotting_mixin.PlottingMixinVisualize when animals are directing towards ROIs. Draws the ROIs on the video frames, overlays pose-estimation body-parts, and draws directing lines (funnel or line style) from the animal eye midpoint to the ROI when the animal is directing towards the ROI. A text panel shows the directing boolean for each animal-ROI combination per frame. Uses multiprocessing.
- Parameters
config_path (Union[str, os.PathLike]) – Path to SimBA project config file in Configparser format.
video_path (Union[str, os.PathLike]) – Path to video file to overlay directing visualization on.
direction_style (Literal['funnel', 'lines']) – Style of direction line. Default ‘funnel’.
direction_color (Tuple[int, int, int]) – BGR color of the directing line. Default (0, 0, 255) (red).
direction_thickness (Optional[int]) – Thickness of the directing line (used for ‘lines’ style). If None, computed automatically based on video resolution. Default None.
circle_size (Optional[int]) – Size of the pose-estimation keypoint circles. If None, computed automatically based on video resolution. Default None.
show_pose (bool) – If True, draw pose-estimation keypoints on the video. Default True.
show_roi_centers (bool) – If True, draw the center of each ROI. Default True.
show_animal_names (bool) – If True, display animal names on the video. Default False.
border_bg_clr (Tuple[int, int, int]) – BGR color for the text panel background. Default (0, 0, 0).
time_slice (Optional[Dict[str, str]]) – Optional dict with ‘start_time’ and ‘end_time’ keys (HH:MM:SS format) to visualize a sub-clip. Default None.
roi_coordinates_path (Optional[Union[str, os.PathLike]]) – Optional path to ROI definitions file. If None, uses the project default. Default None.
left_ear_name (Optional[str]) – Optional custom left ear body-part name. Default None.
right_ear_name (Optional[str]) – Optional custom right ear body-part name. Default None.
nose_name (Optional[str]) – Optional custom nose body-part name. Default None.
core_cnt (int) – Number of CPU cores for multiprocessing. -1 uses all available. Default -1.
gpu (bool) – If True, use GPU for video concatenation when available. Default False.
verbose (bool) – If True, print progress messages during visualization. Default True.
- Example
>>> viz = DirectingROIVisualizer(config_path='/path/to/project_config.ini',
...                              video_path='/path/to/video.mp4',
...                              direction_style='funnel',
...                              show_pose=True,
...                              core_cnt=4)
>>> viz.run()
ROI visualizer
- class simba.plotting.roi_plotter.ROIPlotter(config_path, video_path, body_parts, outside_roi=False, threshold=0.0, verbose=True, show_animal_name=False, show_body_part=True, show_bbox=False, data_path=None, save_path=None, bp_colors=None, bp_sizes=None, border_bg_clr=(0, 0, 0))[source]
Bases:
simba.mixins.config_reader.ConfigReaderVisualize the ROI data (number of entries/exits, time-spent in ROIs etc).
Note
See also
Use
simba.plotting.ROI_plotter_mp.ROIPlotMultiprocess()for improved run-time.
- param Union[str, os.PathLike] config_path
Path to SimBA project config file in Configparser format.
- param Union[str, os.PathLike] video_path
Path to video file to create ROI visualizations for.
- param List[str] body_parts
List of the body-parts to use as proxy for animal locations.
- param bool outside_roi
If True, SimBA will treat all areas NOT covered by a ROI drawing as a single additional ROI and visualize the stats for this single ROI. Default: False.
- param float threshold
Float between 0 and 1. Body-part locations detected below this confidence threshold are filtered. Default: 0.0.
- param Optional[bool] verbose
If True, print progress messages during video creation. Default: True.
- param bool show_animal_name
If True, display animal names on the video frames. Default: False.
- param bool show_body_part
If True, display body-part locations as circles on the video frames. Default: True.
- param Optional[Union[str, os.PathLike]] data_path
Optional path to the pose-estimation data. If None, then locates file in
outlier_corrected_movement_locationdirectory. Default: None.- param Optional[Union[str, os.PathLike]] save_path
Optional path to where to save video. If None, then saves it in
frames/output/roi_analysisdirectory of SimBA project. Default: None.- param Optional[List[Tuple[int, int, int]]] bp_colors
Optional list of tuples of same length as body_parts representing the colors of the body-parts in RGB format. Defaults to None and colors are automatically chosen. Default: None.
- param Optional[List[Union[int]]] bp_sizes
Optional list of integers representing the sizes of the pose estimated body-part location circles. Defaults to None and size is automatically inferred. Default: None.
- param Tuple[int, int, int] border_bg_clr
RGB tuple representing the background color of the border area where statistics are displayed. Default: (0, 0, 0).
- example
>>> test = ROIPlotter(config_path=r'/Users/simon/Desktop/envs/simba/troubleshooting/mouse_open_field/project_folder/project_config.ini',
>>>                video_path="/Users/simon/Desktop/envs/simba/troubleshooting/mouse_open_field/project_folder/videos/SI_DAY3_308_CD1_PRESENT.mp4",
>>>                body_parts=['Nose'],
>>>                show_body_part=True,
>>>                show_animal_name=True)
>>> test.run()
- example II
>>> test = ROIPlotter(config_path=r"C:      roubleshooting\mitra\project_folder\project_config.ini",
>>>               video_path=r"C:   roubleshooting\mitra\project_folder
- ideosŁ_MA142_Gi_Saline_0513.mp4”,
>>>               body_parts=['Nose'],
>>>               show_body_part=True,
>>>               show_animal_name=False)
>>> test.run()
ROI visualizer - multiprocess
- class simba.plotting.roi_plotter_mp.ROIPlotMultiprocess(config_path, video_path, body_parts, threshold=0.0, core_cnt=- 1, verbose=True, outside_roi=False, show_body_part=True, font=None, show_animal_name=False, bbox=None, print_timer='seconds', border_bg_clr=(0, 0, 0), data_path=None, save_path=None, bp_colors=None, bp_sizes=None, gpu=False)[source]
Bases:
simba.mixins.config_reader.ConfigReader,simba.mixins.plotting_mixin.PlottingMixinVisualize the ROI data (number of entries/exits, time-spent in ROIs) using multiprocessing for improved performance.
Note
- Parameters
config_path (Union[str, os.PathLike]) – Path to SimBA project config file in Configparser format.
video_path (Union[str, os.PathLike]) – Path to video file to create ROI visualizations for.
body_parts (List[str]) – List of the body-parts to use as proxy for animal locations.
threshold (float) – Float between 0 and 1. Body-part locations detected below this confidence threshold are filtered. Default: 0.0.
core_cnt (int) – Number of cores to use for multiprocessing. Default: -1 (uses all available cores).
verbose (bool) – If True, print progress messages during video creation. Default: True.
outside_roi (bool) – If True, SimBA will treat all areas NOT covered by a ROI drawing as a single additional ROI and visualize the stats for this single ROI. Default: False.
show_body_part (bool) – If True, display body-part locations as circles on the video frames. Default: True.
show_animal_name (bool) – If True, display animal names on the video frames. Default: False.
bbox (Optional[Literal['axis-aligned', 'animal-aligned']]) – If not None, draw bounding boxes around each animal.
'axis-aligned'= rectangle aligned with video axes;'animal-aligned'= minimum rotated rectangle aligned with the animal’s orientation. Default: None (no bounding boxes).print_timer (Literal['seconds', 'hh:mm:ss.ssss']) – Timer format for behavior/ROI counters shown in the border panel.
'seconds'= numeric seconds,'hh:mm:ss.ssss'= clock-style timestamp with fractional seconds. Default:'seconds'.border_bg_clr (Tuple[int, int, int]) – RGB tuple representing the background color of the border area where statistics are displayed. Default: (0, 0, 0).
data_path (Optional[Union[str, os.PathLike]]) – Optional path to the pose-estimation data. If None, then locates file in
outlier_corrected_movement_locationdirectory. Default: None.save_path (Optional[Union[str, os.PathLike]]) – Optional path to where to save video. If None, then saves it in
frames/output/roi_analysisdirectory of SimBA project. Default: None.bp_colors (Optional[List[Tuple[int, int, int]]]) – Optional list of tuples of same length as body_parts representing the colors of the body-parts in RGB format. Defaults to None and colors are automatically chosen. Default: None.
bp_sizes (Optional[List[Union[int]]]) – Optional list of integers representing the sizes of the pose estimated body-part location circles. Defaults to None and size is automatically inferred. Default: None.
gpu (bool) – If True, use GPU acceleration for video concatenation. Default: False.
- Example
>>> test = ROIPlotMultiprocess(config_path=r'/Users/simon/Desktop/envs/simba/troubleshooting/mouse_open_field/project_folder/project_config.ini',
>>>                            video_path="/Users/simon/Desktop/envs/simba/troubleshooting/mouse_open_field/project_folder/videos/SI_DAY3_308_CD1_PRESENT.mp4",
>>>                            core_cnt=7,
>>>                            body_parts=['Nose'],
>>>                            show_body_part=True,
>>>                            show_animal_name=False)
>>> test.run()
Circular base feature plotter
- class simba.plotting.circular_feature_overlay_plotter.CircularFeaturePlotter(config_path, data_path, settings)[source]
Bases:
simba.mixins.config_reader.ConfigReader,simba.mixins.plotting_mixin.PlottingMixin,simba.mixins.feature_extraction_mixin.FeatureExtractionMixinCreate visualization of base angular features overlay on video. E.g., use to confirm accurate cardinality and angle degree computation.
- Parameters
config_path (Union[str, os.PathLike]) – path to SimBA project config file in Configparser format
data_path (Union[str, os.PathLike]) – Path to file containing angular features.
settings (dict) – Dictionary containing visualization attributes.
- Example
>>> settings = {'center': {'Animal_1': 'SwimBladder'}, 'text_settings': False, "palette": 'bwr'}
>>> circular_feature_plotter = CircularFeaturePlotter(config_path='/Users/simon/Desktop/envs/troubleshooting/circular_features_zebrafish/project_folder/project_config.ini', data_path='/Users/simon/Desktop/envs/troubleshooting/circular_features_zebrafish/project_folder/csv/circular_features/20200730_AB_7dpf_850nm_0002.csv', settings=settings)
>>> circular_feature_plotter.run()
Circular diffusion plotting
- class simba.plotting.circular_plotting.CircularPlotting[source]
Bases:
simba.mixins.plotting_mixin.PlottingMixin- diffusion_plot(data, fps, degree_width=5, palette='jet', title=None, save_path=None)[source]
Create polar plot representing the within a video.

- Parameters
data (np.ndarray) – 1D np.ndarray with angle in degrees with one entry per frame.
degree_width (int) – The width of the bars in the plot.
palette (str) – The polar plot palette.
title (str) – Title of the plot
save_path (Optional[Union[str, os.PathLike]]) – Plot save location on disk. If None, then return plt.figure polar plot.
- Example
>>> data = np.random.normal(loc=180, scale=99, size=5000)
>>> _ = CircularPlotting().diffusion_plot(data=data, title='Mean 180 degree plot', fps=30, degree_width=5, palette='jet', save_path='/Users/simon/Desktop/envs/troubleshooting/circular_features_zebrafish/project_folder/frames/output/dispersion/20200730_AB_7dpf_850nm_0004.png')
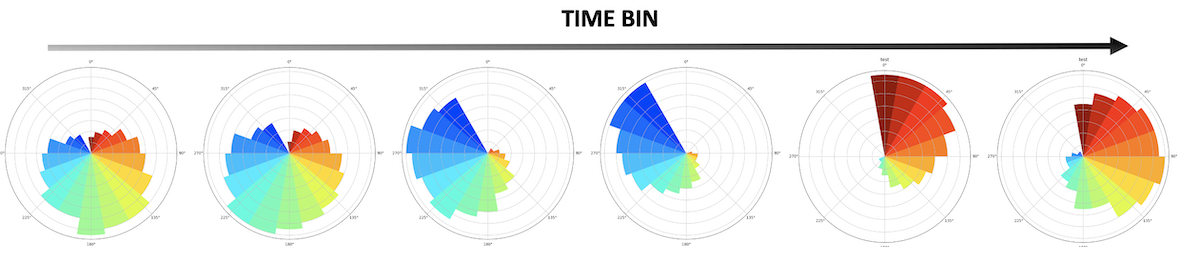
- diffusion_time_bin_plot(data, fps, time_bin, degree_width, palette, save_path)[source]
Create polar plots representing angular diffusion within each N second time-bin of the video.
- Parameters
data (np.ndarray) – 1D np.ndarray with angle in degrees with one entry per frame.
fps (int) – Framerate the video was recorded in.
time_bin (int) – The length of each time bin (one plot will be created per time bin).
degree_width (int) – The width of the bars in the plot.
palette (str) – The polar plot palette.
save_path (Optional[Union[str, os.PathLike]]) – Plot save location on disk. If None, then return plt.figure polar plot.
- Example
>>> data = np.random.normal(loc=180, scale=99, size=5000)
>>> _ = CircularPlotting().diffusion_time_bin_plot(data=data, fps=30, degree_width=40, palette='jet', save_path='/Users/simon/Desktop/envs/troubleshooting/circular_features_zebrafish/project_folder/frames/output/dispertion_time_series/20200730_AB_7dpf_850nm_0004', time_bin=10)
Classifier validation
- class simba.plotting.clf_validator.ClassifierValidationClips(config_path, window, clf_name, data_paths, text_clr=(255, 105, 180), concat_video=False, clips=False, video_speed=1.0, highlight_clr=None)[source]
Bases:
simba.mixins.config_reader.ConfigReaderCreate video clips with overlaid classified events for detection of false positive event bouts.
- Parameters
config_path (str) – path to SimBA project config file in Configparser format
window (int) – Number of seconds before and after the event bout that should be included in the output video.
clf_name (str) – Name of the classifier to create validation videos for.
clips (bool) – If True, creates individual video file clips for each validation bout.
text_clr (Tuple[int, int, int]) – Color of text overlay in BGR.
highlight_clr (Optional[Tuple[int, int, int]]) – Color of text when probability values are above threshold. If None, same as text_clr.
video_speed (float) – FPS rate in relation to original video. E.g., the same as original video if 1.0. Default: 1.0.
concat_video (bool) – If True, creates a single video including all events bouts for each video. Default: False.
Note

- Examples
>>> _ = ClassifierValidationClips(config_path='MyProjectConfigPath', window=5, clf_name='Attack', text_clr=(255,255,0), clips=False, concat_video=True).run()
Classifier validation - multiprocess
- class simba.plotting.clf_validator_mp.ClassifierValidationClipsMultiprocess(config_path, window, clf_name, clips, data_paths, text_clr, concat_video=False, video_speed=1.0, highlight_clr=None, core_cnt=- 1)[source]
Bases:
simba.mixins.config_reader.ConfigReaderCreate video clips with overlaid classified events for detection of false positive event bouts using multiple cores for improved runtime.
- Parameters
config_path (str) – path to SimBA project config file in Configparser format
window (int) – Number of seconds before and after the event bout that should be included in the output video.
clf_name (str) – Name of the classifier to create validation videos for.
clips (bool) – If True, creates individual video file clips for each validation bout.
data_paths (List[Union[str, os.PathLike]]) – List of files with classification results to create videos for.
text_clr (Tuple[int, int, int]) – Color of text overlay in BGR.
highlight_clr (Optional[Tuple[int, int, int]]) – Color of text when probability values are above threshold. If None, same as text_clr.
video_speed (float) – FPS rate in relation to original video. E.g., the same as original video if 1.0. If output should be half the speed relative to input, set to 0.5. Default: 1.0.
concat_video (bool) – If True, creates a single video including all events bouts for each video. Default: False.
core_cnt (Optional[int]) – Integer dictating the numbers of cores to use. If -1, all available cores are used.
Note
Examples
>>> _ = ClassifierValidationClipsMultiprocess(config_path='MyProjectConfigPath', window=5, clf_name='Attack', text_clr=(255,255,0), clips=False, concat_video=True).run()
Data plotter
- class simba.plotting.data_plotter.DataPlotter(config_path, body_parts, data_paths, bg_clr=(255, 255, 255), header_clr=(0, 0, 0), font_thickness=2, img_size=(640, 480), decimals=2, video_setting=True, frame_setting=False, verbose=True)[source]
Bases:
simba.mixins.config_reader.ConfigReaderTabular data visualization of animal movement and distances in the current frame and their aggregate statistics.
- Parameters
config_path (Union[str, os.PathLike]) – Path to the SimBA project config file in ConfigParser format.
body_parts (List[Tuple[str, Tuple[int, int, int]]]) – A list of tuples, where each tuple consists of a body-part name (str) and an RGB tuple (int, int, int) indicating the text color used for that body-part in plots.
data_paths (List[Union[str, os.PathLike]]) – List of paths to the CSV files containing time-binned animal movement data.
bg_clr (Tuple[int, int, int]) – Background color of the output image(s) as an RGB tuple. Default is white (255, 255, 255).
header_clr (Tuple[int, int, int]) – Text color for the header labels (e.g., “ANIMAL”, “TOTAL MOVEMENT”) as an RGB tuple. Default is black (0, 0, 0).
font_thickness (int) – Thickness of the font used in output images. Must be >= 1. Default is 2.
img_size (Tuple[int, int]) – Size of the output image as a tuple (width, height). Default is (640, 480).
decimals (int) – Number of decimal places to round movement and velocity values. Must be >= 0. Default is 2.
video_setting (bool) – Whether to generate a video output of the data plot. At least one of video_setting or frame_setting must be True.
frame_setting (bool) – Whether to generate individual frame image outputs for each time bin.
verbose (bool) – Whether to print progress information during execution. Default is True.
Note
Tutorial <https://github.com/sgoldenlab/simba/blob/master/docs/Scenario2.md#visualizing-data-tables>_.

- Examples
>>> _ = DataPlotter(config_path='MyConfigPath').run()
Distance plotter
- class simba.plotting.distance_plotter.DistancePlotterSingleCore(config_path, data_paths, style_attr, line_attr, frame_setting=False, video_setting=False, last_frame_as_svg=False, final_img=False)[source]
Bases:
simba.mixins.config_reader.ConfigReaderVisualize frame-wise body-part distances as line plots using single-core processing.
Produces one or more of: (i) frame-by-frame plot images, (ii) a dynamic distance-plot video, (iii) a final static distance plot (PNG or SVG).
Note
For better runtime, use
simba.plotting.distance_plotter_mp.DistancePlotterMultiCore(). GitHub tutorial/documentation.
- Parameters
config_path (Union[str, os.PathLike]) – Path to SimBA project config file.
data_paths (List[Union[str, os.PathLike]]) – One or more pose data files to process.
style_attr (Dict[str, int]) – Plot style dictionary. Expected keys include
width,height,line width,font size,y_max, andopacity.line_attr (List[List[str]]) – Distance definitions. Each entry is
[body_part_1, body_part_2, color_name].frame_setting (bool) – If
True, save one plot image per frame. Default:False.video_setting (bool) – If
True, save a video of the plot building over time. Default:False.last_frame_as_svg (bool) – If
True, final static distance image is saved as SVG; else PNG. Default:False.final_img (bool) – If
True, save a final static distance plot for each video. Default:False.
- Examples
>>> style_attr = {'width': 640, 'height': 480, 'line width': 6, 'font size': 8, 'opacity': 0.5}
>>> line_attr = {0: ['Center_1', 'Center_2', 'Green'], 1: ['Ear_left_2', 'Ear_left_1', 'Red']}
>>> distance_plotter = DistancePlotterSingleCore(config_path=r'MyProjectConfig', files_found=['test/two_c57s/project_folder/csv/outlier_corrected_movement_location/Video_1.csv'], frame_setting=False, video_setting=True, final_img=True)
>>> distance_plotter.run()
Distance plotter - multiprocess
- class simba.plotting.distance_plotter_mp.DistancePlotterMultiCore(config_path, data_paths, frame_setting, video_setting, final_img, style_attr, line_attr, core_cnt=- 1, last_frame_as_svg=False)[source]
Bases:
simba.mixins.config_reader.ConfigReader,simba.mixins.plotting_mixin.PlottingMixinVisualize frame-wise body-part distances as line plots using multiprocessing.
Produces one or more of: (i) frame-by-frame plot images, (ii) a dynamic distance-plot video, (iii) a final static distance plot (PNG or SVG).
- param Union[str, os.PathLike] config_path
Path to SimBA project config file.
- param List[Union[str, os.PathLike]] data_paths
One or more pose data files to process.
- param bool frame_setting
If
True, save one plot image per frame.- param bool video_setting
If
True, save a video of the plot building over time.- param bool final_img
If
True, save a final static distance plot for each video.- param Dict[str, int] style_attr
Plot style dictionary. Expected keys include
width,height,line width,font size,y_max, andopacity.- param List[List[str]] line_attr
Distance definitions. Each entry is
[body_part_1, body_part_2, color_name].- param Optional[int] core_cnt
Number of CPU cores.
-1uses all available cores. Default:-1.- param bool last_frame_as_svg
If
True, final static distance image is saved as SVG; else PNG. Default:False.

- Example
>>> style_attr = {'width': 640, 'height': 480, 'line width': 6, 'font size': 8, 'opacity': 0.5}
>>> line_attr = {0: ['Center_1', 'Center_2', 'Green'], 1: ['Ear_left_2', 'Ear_left_1', 'Red']}
>>> distance_plotter = DistancePlotterMultiCore(config_path=r'/tests_/project_folder/project_config.ini', frame_setting=False, video_setting=True, final_img=True, style_attr=style_attr, line_attr=line_attr,  files_found=['/test_/project_folder/csv/machine_results/Together_1.csv'], core_cnt=5)
>>> distance_plotter.run()
Quick path plot (Ez path plot)
- class simba.plotting.ez_path_plot.EzPathPlot(data_path, body_part, bg_color=(255, 255, 255), line_color=(147, 20, 255), video_path=None, size=None, fps=None, line_thickness=10, circle_size=5, last_frm_only=False, save_path=None)[source]
Bases:
objectCreate a simpler path plot for a single path in a single video.
Note
For more refined / complex path plots with/without multiprocessing for inproved speed, see
simba.plotting.path_plotter.PathPlotterSingleCoreandsimba.plotting.path_plotter_mp.PathPlotterMulticore.- Parameters
data_path (Union[str, os.PathLike]) – The path to the data file in H5c or CSV format containing the pose estimation coordinates.
video_path (Optional[Union[str, os.PathLike]]) – The path to the video file. Optional. If provided, the FPS and size is grabbed from the metadata of the video file. If None, then pass
fpsandsize.size (Optional[Tuple[int, int]]) – Size of the path plot (width, height). Used if video_path is None.
fps (Optional[int]) – The FPS of the path plot. Used if video_path is None.
body_part (str) – The specific body part to plot the path for.
last_frm_only (Optional[bool]) – If True, creates just a single .png image representing the full path in last image in the video.
bg_color (Optional[Tuple[int, int, int]]) – The background color of the plot. Defaults to (255, 255, 255).
line_color (Optional[Tuple[int, int, int]]) – The color of the path line. Defaults to (147, 20, 255).
line_thickness (Optional[int]) – The thickness of the path line. Defaults to 10.
circle_size (Optional[int]) – The size of the circle indicating each data point. Defaults to 5.
save_path (Optional[Union[str, os.PathLike]]) – The location to store the path plot. If None, then use the same path as the data path with
_line_plotsuffix.
- Example I
>>> path_plotter = EzPathPlot(data_path='/Users/simon/Desktop/envs/simba/troubleshooting/two_black_animals_14bp/h5/Together_1DLC_resnet50_two_black_mice_DLC_052820May27shuffle1_150000_el.h5', video_path='/Users/simon/Desktop/envs/simba/troubleshooting/two_black_animals_14bp/project_folder/videos/Together_1.avi', body_part='Mouse_1_Nose', bg_color=(255, 255, 255), line_color=(147,20,255))
>>> path_plotter.run()
- Example II
>>> path_plotter = EzPathPlot(data_path='/Users/simon/Desktop/envs/simba/troubleshooting/two_black_animals_14bp/h5/Together_1DLC_resnet50_two_black_mice_DLC_052820May27shuffle1_150000_el.h5', size=(2056, 1549), fps=30, body_part='Mouse_1_Nose', bg_color=(255, 255, 255), line_color=(147,20,255))
>>> path_plotter.run()
Merge videos
- class simba.plotting.frame_mergerer_ffmpeg.FrameMergererFFmpeg(concat_type, video_paths, video_height=None, video_width=None, config_path=None, quality=23, gpu=False)[source]
Bases:
simba.mixins.config_reader.ConfigReaderMerge separate visualizations of classifications, descriptive statistics etc., into single video mosaic.
- Parameters
config_path (str) – Optional path to SimBA project config file in Configparser format.
concat_type (Literal["horizontal", "vertical", "mosaic", "mixed_mosaic"]) – Type of concatenation. OPTIONS: ‘horizontal’, ‘vertical’, ‘mosaic’, ‘mixed_mosaic’.
video_paths (List[Union[str, os.PathLike]]) – List with videos to concatenate.
quality (int) – Video quality (CRF value). Lower values = higher quality. Range 0-52. Default 23.
video_height (Optional[int]) – Optional height of the canatenated videos. Required if concat concat_type is not mixed_mosaic.
video_width (int) – Optional wisth of the canatenated videos. Required if concat concat_type is not mixed_mosaic.
gpu (Optional[bool]) – If True, use NVIDEA FFMpeg GPU codecs. Default False.
- Example
>>> video_paths = ['/Users/simon/Desktop/envs/simba/troubleshooting/mouse_open_field/project_folder/videos/SI_DAY3_308_CD1_PRESENT_downsampled.mp4', '/Users/simon/Desktop/envs/simba/troubleshooting/mouse_open_field/project_folder/videos/SI_DAY3_308_CD1_PRESENT_downsampled.mp4']
>>> merger = FrameMergererFFmpeg(config_path='/Users/simon/Desktop/envs/simba/troubleshooting/two_black_animals_14bp/project_folder/project_config.ini', video_paths=videos, video_height=600, video_width=600, concat_type='mosaic')
>>> merger.run()
Gantt plot
- class simba.plotting.gantt_creator.GanttCreatorSingleProcess(config_path, data_paths=None, width=640, height=480, font_size=8, font_rotation=45, font=None, palette='Set1', frame_setting=False, video_setting=False, last_frm_setting=True, last_frame_as_svg=False, hhmmss=True, clf_names=None)[source]
Bases:
simba.mixins.config_reader.ConfigReader,simba.mixins.plotting_mixin.PlottingMixinCreate classifier Gantt charts using single-process execution.
Generates one or more of: (i) frame-by-frame Gantt images, (ii) dynamic Gantt videos, (iii) a final static Gantt image (PNG or SVG).
Note
See also
For multiprocessing alternative, see
simba.plotting.gantt_creator_mp.GanttCreatorMultiprocess.
- Parameters
config_path (Union[str, os.PathLike]) – Path to SimBA project config file.
data_paths (Optional[Union[Union[str, os.PathLike], List[Union[str, os.PathLike]]]]) – File path, list of file paths, or
None(all machine result files in project).width (int) – Width of output images/videos in pixels. Default: 640.
height (int) – Height of output images/videos in pixels. Default: 480.
font_size (int) – Font size for behavior labels. Default: 8.
font_rotation (int) – Rotation angle for y-axis labels in degrees (0-180). Default: 45.
font (Optional[str]) – Matplotlib font name. If
None, default font is used.palette (str) – Color palette name for behaviors. Default: ‘Set1’.
frame_setting (bool) – If
True, creates individual frame images. Default:False.video_setting (bool) – If
True, creates dynamic Gantt videos. Default:False.last_frm_setting (bool) – If
True, creates a final static Gantt image. Default:True.last_frame_as_svg (bool) – If
True, saves final static frame as SVG; else PNG. Default:False.hhmmss (bool) – If
True, x-axis labels are formatted asHH:MM:SS. IfFalse, seconds are used. Default:True.clf_names (Optional[List[str]]) – Optional subset of classifiers to include. If
None, uses all project classifiers.
- Example
>>> gantt_creator = GanttCreatorSingleProcess(config_path='project_config.ini', video_setting=True, data_paths=['csv/machine_results/video1.csv'], hhmmss=True, last_frm_setting=True)
>>> gantt_creator.run()
Gantt plot - multiprocess
- class simba.plotting.gantt_creator_mp.GanttCreatorMultiprocess(config_path, data_paths=None, frame_setting=False, video_setting=False, last_frm_setting=True, last_frame_as_svg=False, width=640, height=480, font_size=8, font_rotation=45, font=None, bar_opacity=0.85, palette='Set1', core_cnt=- 1, hhmmss=False, clf_names=None)[source]
Bases:
simba.mixins.config_reader.ConfigReader,simba.mixins.plotting_mixin.PlottingMixinCreate classifier Gantt charts using multiprocessing for faster generation.
Generates one or more of: (i) frame-by-frame Gantt images, (ii) dynamic Gantt videos, (iii) a final static Gantt image (PNG or SVG).
Note
See also
For single-process alternative, see
simba.plotting.gantt_creator.GanttCreatorSingleProcess.
- Parameters
config_path (Union[str, os.PathLike]) – Path to SimBA project config file.
data_paths (Optional[Union[Union[str, os.PathLike], List[Union[str, os.PathLike]]]]) – File path, list of file paths, or
None(all machine result files in project).frame_setting (bool) – If
True, creates individual frame images. Default:False.video_setting (bool) – If
True, creates dynamic Gantt videos. Default:False.last_frm_setting (bool) – If
True, creates a final static Gantt image. Default:True.last_frame_as_svg (bool) – If
True, saves final static frame as SVG; else PNG. Default:False.width (int) – Width of output images/videos in pixels. Default: 640.
height (int) – Height of output images/videos in pixels. Default: 480.
font_size (int) – Font size for behavior labels. Default: 8.
font_rotation (int) – Rotation angle for y-axis labels in degrees (0-180). Default: 45.
font (Optional[str]) – Matplotlib font name. If
None, default font is used.bar_opacity (float) – Opacity of Gantt bars in range (0, 1]. Default:
0.85.palette (str) – Color palette name for behaviors. Default: ‘Set1’.
core_cnt (Optional[int]) – Number of CPU cores to use. If -1, uses all available cores. Default: -1.
hhmmss (bool) – If
True, x-axis labels are formatted asHH:MM:SS. IfFalse, seconds are used. Default:False.clf_names (Optional[List[str]]) – Optional subset of classifiers to include. If
None, uses all project classifiers.
- Example
>>> gantt_creator = GanttCreatorMultiprocess(config_path='project_config.ini', video_setting=True, data_paths=['csv/machine_results/video1.csv'], core_cnt=5, hhmmss=True, last_frm_setting=True)
>>> gantt_creator.run()
Gantt plot - fancy
Classifier heatmaps
- class simba.plotting.heat_mapper_clf.HeatMapperClfSingleCore(config_path, bodypart, clf_name, data_paths, style_attr, final_img_setting=True, video_setting=False, frame_setting=False)[source]
Bases:
simba.mixins.config_reader.ConfigReader,simba.mixins.plotting_mixin.PlottingMixinCreate heatmaps representing the locations of the classified behavior.
Note
GitHub visualizations tutorial. For improved run-time, see
simba.heat_mapper_clf_mp.HeatMapperClfMultiprocess()for multiprocess class.
- Parameters
config_path (str) – path to SimBA project config file in Configparser format
final_img_setting (bool) – If True, then create a single image representing the last frame of the input video
video_setting (bool) – If True, then create a video of heatmaps.
frame_setting (bool) – If True, then create individual heatmap frames.
clf_name (str) – The name of the classified behavior.
bodypart (str) – The name of the body-part used to infer the location of the classified behavior
style_attr (Dict) – Dict containing settings for colormap, bin-size, max scale, and smooothing operations. For example: {‘palette’: ‘jet’, ‘shading’: ‘gouraud’, ‘bin_size’: 50, ‘max_scale’: ‘auto’}.
- Example
>>> test = HeatMapperClfSingleCore(config_path=r"C: roubleshooting\RAT_NOR\project_folder\project_config.ini", >>> style_attr = {'palette': 'jet', 'shading': 'gouraud', 'bin_size': 50, 'max_scale': 'auto'}, >>> final_img_setting=True, >>> video_setting=True, >>> frame_setting=False, >>> bodypart='Ear_left', >>> clf_name='straub_tail', >>> data_paths=[r"C: roubleshooting\RAT_NOR\project_folder\csv est2-06-20_NOB_DOT_4.csv"]) >>> test.run()
Classifier heatmaps - multiprocess
- class simba.plotting.heat_mapper_clf_mp.HeatMapperClfMultiprocess(config_path, bodypart, clf_name, data_paths, style_attr, show_legend=True, final_img_setting=True, bg_img=None, heatmap_opacity=None, video_setting=False, verbose=True, line_clr=None, show_keypoint=False, min_seconds=None, frame_setting=False, time_slice=None, core_cnt=- 1)[source]
Bases:
simba.mixins.config_reader.ConfigReader,simba.mixins.plotting_mixin.PlottingMixinCreate heatmaps representing the locations of the classified behavior.

- Parameters
config_path (Union[str, os.PathLike]) – Path to SimBA project config file.
bodypart (str) – Body-part used to locate where the behavior occurs. When the classifier fires, SimBA records this body-part’s position.
clf_name (str) – Name of the classifier/behavior to visualize (e.g. ‘Attack’, ‘Grooming’).
data_paths (List[str]) – Path(s) to classifier results CSV files (from machine_results). Must match videos in project.
style_attr (Dict[str, Any]) – Dict with keys ‘palette’, ‘shading’, ‘bin_size’, ‘max_scale’. E.g. {‘palette’: ‘jet’, ‘shading’: ‘gouraud’, ‘bin_size’: 50, ‘max_scale’: ‘auto’}.
show_legend (bool) – If True, append color bar showing seconds scale. Default True.
final_img_setting (bool) – If True, create a single cumulative heatmap image. Default True.
bg_img (Optional[int]) – If set, overlay heatmap on video frame. -1 or None = no background. Non-negative int = frame index for static background.
heatmap_opacity (Optional[float]) – Opacity of heatmap over background (0–1). Used when bg_img is set. Default None.
video_setting (bool) – If True, create heatmap video. Default False.
verbose (bool) – If True, print progress. Default True.
show_keypoint (bool) – If True, draw body-part position as dot on each frame. Default False.
min_seconds (Optional[int]) – Hide bins with time below this (seconds). Bins below threshold appear empty. Default None.
frame_setting (bool) – If True, create individual heatmap frame images. Default False.
time_slice (Optional[Dict[str, str]]) – If set, restrict analysis to time period. Dict with keys ‘start_time’ and ‘end_time’ (HH:MM:SS). Default None.
core_cnt (int) – Number of CPU cores. -1 = use all available. Default -1.
- Example
>>> style_attr = {'palette': 'jet', 'shading': 'gouraud', 'bin_size': 50, 'max_scale': 'auto'}
>>> heatmapper = HeatMapperClfMultiprocess(config_path='project_config.ini', bodypart='Nose_1', clf_name='Attack', data_paths=['csv/machine_results/Video1.csv'], style_attr=style_attr, final_img_setting=True, video_setting=False, frame_setting=False, core_cnt=-1)
>>> heatmapper.run()
Location heatmaps
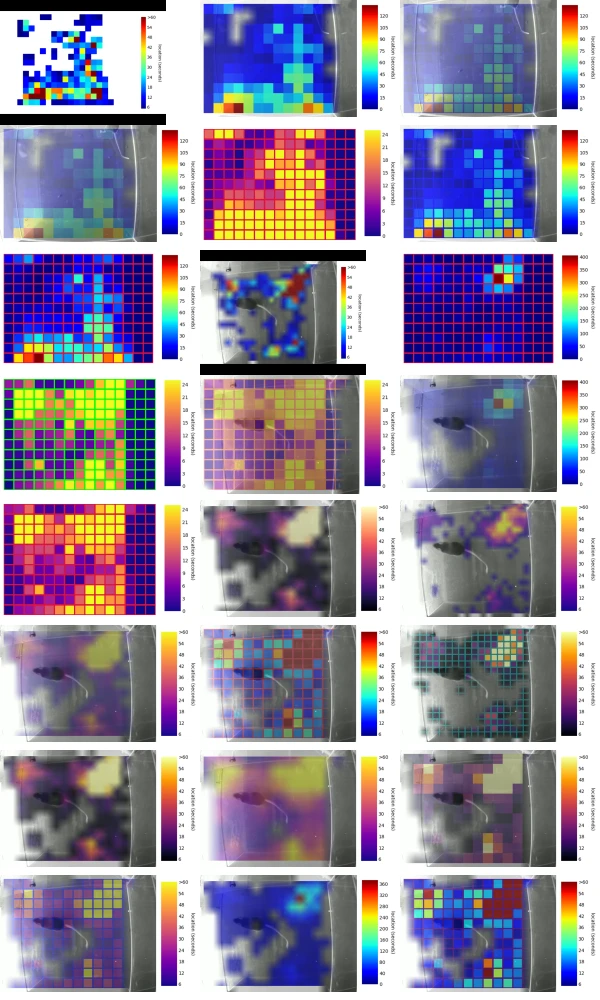
- class simba.plotting.heat_mapper_location.HeatmapperLocationSingleCore(config_path, data_paths, bodypart, style_attr, final_img_setting=True, video_setting=False, frame_setting=False)[source]
Bases:
simba.mixins.config_reader.ConfigReader,simba.mixins.plotting_mixin.PlottingMixinCreate heatmaps representing the location where animals spend time. For improved run-time, see
simba.heat_mapper_location_mp.HeatMapperLocationMultiprocess()for multiprocess class.Note
- GitHub visualizations tutorial.
For improved run-time of videos, see
simba.heat_mapper_location_mp.HeatMapperLocationMultiprocess()for multiprocess class.
- Parameters
config_path (str) – path to SimBA project config file in Configparser format
bodypart (str) – The name of the body-part used to infer the location of the animal.
bin_size (int) – The rectangular size of each heatmap location in millimeters. For example, 50 will divide the video frames into 5 centimeter rectangular spatial bins.
palette (str) – Heatmap pallette. Eg. ‘jet’, ‘magma’, ‘inferno’,’plasma’, ‘viridis’, ‘gnuplot2’
max_scale (int or 'auto') – The max value in the heatmap in seconds. E.g., with a value of 10, if the classified behavior has occurred >= 10s within a rectangular bins, it will be filled with the same color.
final_img_setting (bool) – If True, create a single image representing the last frame of the input video
video_setting (bool) – If True, then create a video of heatmaps.
frame_setting (bool) – If True, then create individual heatmap frames.
- Example
>>> style_attr = {'palette': 'jet', 'shading': 'gouraud', 'bin_size': 100, 'max_scale': 'auto'}
>>> heatmapper = HeatmapperLocationSingleCore(config_path='/Users/simon/Desktop/envs/troubleshooting/two_black_animals_14bp/project_folder/project_config.ini', style_attr = style_attr, final_img_setting=True, video_setting=True, frame_setting=False, bodypart='Nose_1', files_found=['/Users/simon/Desktop/envs/troubleshooting/two_black_animals_14bp/project_folder/csv/machine_results/Together_1.csv'])
>>> heatmapper.run()
Location heatmaps - multiprocess
- class simba.plotting.heat_mapper_location_mp.HeatMapperLocationMultiprocess(config_path, data_paths, bodypart, style_attr, bg_img=None, time_slice=None, show_keypoint=False, show_legend=True, heatmap_opacity=None, min_seconds=None, line_clr=None, final_img_setting=True, video_setting=False, frame_setting=False, core_cnt=- 1, verbose=True)[source]
Bases:
simba.mixins.config_reader.ConfigReader,simba.mixins.plotting_mixin.PlottingMixinCreate heatmaps representing the location where animals spend time.
- Parameters
config_path (Union[str, os.PathLike]) – Path to SimBA project config file.
data_paths (Union[List[Union[str, os.PathLike]], str, os.PathLike]) – Path(s) to outlier-corrected movement or location CSV file(s). If None, uses all files in project.
bodypart (str) – Body-part name used for location heatmap (e.g. ‘Nose_1’). The heatmap shows where this body-part spends time.
style_attr (Dict[str, Any]) – Dict with keys ‘palette’, ‘shading’, ‘bin_size’, ‘max_scale’. E.g. {‘palette’: ‘jet’, ‘shading’: ‘gouraud’, ‘bin_size’: 50, ‘max_scale’: ‘auto’}.
bg_img (Optional[int]) – If set, overlay heatmap on video frame. -1 or None = no background. Non-negative int = frame index to use as background.
time_slice (Optional[Dict[str, str]]) – If set, restrict analysis to time period. Dict with keys ‘start_time’ and ‘end_time’ (HH:MM:SS). Default None.
show_keypoint (bool) – If True, draw body-part position as dot on each frame. Default False.
show_legend (bool) – If True, append color bar showing seconds scale. Default True.
heatmap_opacity (Optional[float]) – Opacity of heatmap over background (0–1). Used when bg_img is set. Default None.
min_seconds (Optional[int]) – Hide bins with time below this (seconds). Bins below threshold shown as empty. Default None.
line_clr (Optional[str]) – Color for grid lines between bins (e.g. ‘white’, ‘red’). None = no grid. Default None.
final_img_setting (Optional[bool]) – If True, create a single cumulative heatmap image. Default True.
video_setting (Optional[bool]) – If True, create heatmap video. Default False.
frame_setting (Optional[bool]) – If True, create individual heatmap frame images. Default False.
core_cnt (Optional[int]) – Number of CPU cores. -1 = use all available. Default -1.
verbose (bool) – If True, print progress. Default True.
- Example
>>> style_attr = {'palette': 'jet', 'shading': 'gouraud', 'bin_size': 100, 'max_scale': 'auto'}
>>> heatmapper = HeatMapperLocationMultiprocess(config_path='project_config.ini', data_paths='csv/outlier_corrected_movement_location/Together_1.csv', bodypart='Nose_1', style_attr=style_attr, core_cnt=-1, final_img_setting=True, video_setting=False, frame_setting=False)
>>> heatmapper.run()
Interactive classifier probability plotter
- class simba.plotting.interactive_probability_grapher.InteractiveProbabilityGrapher(config_path, file_path, model_path, lbl_font_size=16, data_clr=(0, 0, 255), line_clr=(255, 0, 0), show_thresholds=True, show_statistics_legend=True)[source]
Bases:
simba.mixins.config_reader.ConfigReaderLaunch interactive GUI for inspecting classifier probabilities with synchronized video playback.
Displays probability plot with interactive navigation. Double-click plot to jump to frame, use arrow keys to navigate, space to play/pause.
Note

- Parameters
config_path (Union[str, os.PathLike]) – Path to SimBA project config file.
file_path (Union[str, os.PathLike]) – Path to CSV file with classification probability data.
model_path (Union[str, os.PathLike]) – Path to classifier pickle file (.sav) used to generate probabilities.
lbl_font_size (int) – Font size for axis labels. Default: 16.
data_clr (Tuple[int, int, int]) – RGB color for probability line (0-255). Default: (0, 0, 255) [blue].
line_clr (Tuple[int, int, int]) – RGB color for current frame marker line (0-255). Default: (255, 0, 0) [red].
show_thresholds (bool) – If True, displays threshold lines at 0.25, 0.5, and 0.75. Default: True.
show_statistics_legend (bool) – If True, displays statistics box (max, mean, frame count). Default: True.
- Example
>>> interactive_plotter = InteractiveProbabilityGrapher(config_path='project_config.ini', file_path='features.csv', model_path='classifier.sav')
>>> interactive_plotter.run()
Path plotter
- class simba.plotting.path_plotter.PathPlotterSingleCore(config_path, data_paths, animal_attr, style_attr=None, clf_attr=None, frame_setting=False, video_setting=False, last_frame=False, print_animal_names=True, slicing=None, roi=False)[source]
Bases:
simba.mixins.config_reader.ConfigReader,simba.mixins.plotting_mixin.PlottingMixinCreate “path plots” videos and/or images detailing the movement paths of individual animals in SimBA.
Note
For improved run-time, see
simba.path_plotter_mp.PathPlotterMulticore()for multiprocess class.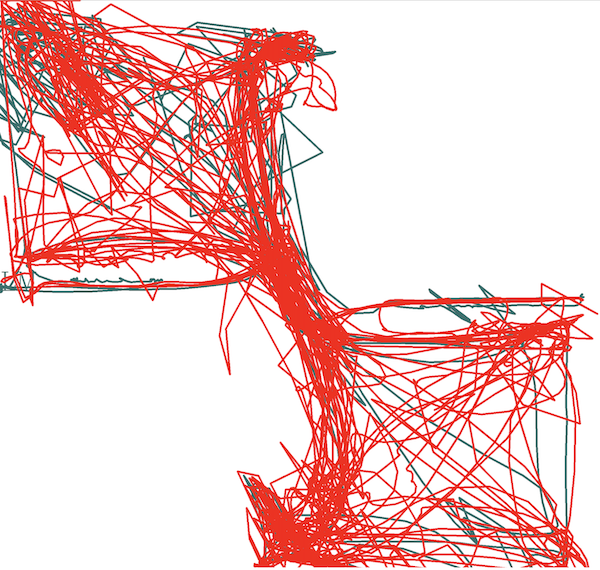

- Parameters
config_path (str) – Path to SimBA project config file in Configparser format
frame_setting (bool) – If True, individual frames will be created.
video_setting (bool) – If True, compressed videos will be created.
files_found (List[str]) – Data paths to create from which to create plots
animal_attr (dict) – Animal body-parts and colors
style_attr (dict) – Plot sttributes (line thickness, color, etc..)
slicing (Optional[dict]) – If Dict, start time and end time of video slice to create path plot from. E.g., {‘start_time’: ‘00:00:01’, ‘end_time’: ‘00:00:03’}. If None, creates path plot for entire video.
roi (Optional[bool]) – If True, also plots the ROIs associated with the video. Default False.
Note
If style_attr[‘bg color’] is a dictionary, e.g., {‘opacity’: 100%}, then SimBA will use the video as background with set opacity.
- Examples
>>> style_attr = {'width': 'As input', 'height': 'As input', 'line width': 5, 'font size': 5, 'font thickness': 2, 'circle size': 5, 'bg color': 'White', 'max lines': 100, 'animal_names': True}
>>> animal_attr = {0: ['Ear_right_1', 'Red']}
>>> path_plotter = PathPlotterSingleCore(config_path=r'MyConfigPath', frame_setting=False, video_setting=True, style_attr=style_attr, animal_attr=animal_attr, files_found=['project_folder/csv/machine_results/MyVideo.csv'], print_animal_names=True).run()
- References
- 1
Boorman, Damien C., Simran K. Rehal, Maryam Fazili, and Loren J. Martin. “Sex and Strain Differences in Analgesic and Hyperlocomotor Effects of Morphine and μ‐Opioid Receptor Expression in Mice.” Journal of Neuroscience Research 103, no. 4 (April 2025): e70039. https://doi.org/10.1002/jnr.70039.
Path plotter - multiprocess
- class simba.plotting.path_plotter_mp.PathPlotterMulticore(config_path, data_paths, animal_attr, style_attr=None, clf_attr=None, frame_setting=False, video_setting=False, last_frame=False, print_animal_names=True, slicing=None, core_cnt=- 1, roi=False, verbose=True)[source]
Bases:
simba.mixins.config_reader.ConfigReader,simba.mixins.plotting_mixin.PlottingMixinClass for creating “path plots” videos and/or images detailing the movement paths of individual animals in SimBA. Uses multiprocessing.
- Parameters
config_path (str) – Path to SimBA project config file in Configparser format
frame_setting (bool) – If True, individual frames will be created.
video_setting (bool) – If True, compressed videos will be created.
last_frame (bool) – If True, png of the last frame will be created.
files_found (List[str]) – Data paths to create path plots for (e.g., [‘project_folder/csv/machine_results/MyVideo.csv’])
animal_attr (dict) – Animal body-parts to use when creating paths and their colors.
input_style_attr (Optional[dict]) – Plot sttributes (line thickness, color, etc..). If None, then autocomputed. Max lines will be set to 2s.
input_clf_attr (Optional[dict]) – Dict reprenting classified behavior locations, their color and size. If None, then no classified behavior locations are shown.
slicing (Optional[dict]) – If Dict, start time and end time of video slice to create path plot from. E.g., {‘start_time’: ‘00:00:01’, ‘end_time’: ‘00:00:03’}. If None, creates path plot for entire video.
roi (Optional[bool]) – If True, also plots the ROIs associated with the video. Default False.
cores (int) – Number of cores to use.
Note
- Example
>>> input_style_attr = {'width': 'As input', 'height': 'As input', 'line width': 5, 'font size': 5, 'font thickness': 2, 'circle size': 5, 'bg color': 'White', 'max lines': 100}
>>> animal_attr = {0: ['Ear_right_1', 'Red']}
>>> input_clf_attr = {0: ['Attack', 'Black', 'Size: 30'], 1: ['Sniffing', 'Red', 'Size: 30']}
>>> path_plotter = PathPlotterMulticore(config_path=r'MyConfigPath', frame_setting=False, video_setting=True, style_attr=style_attr, animal_attr=animal_attr, files_found=['project_folder/csv/machine_results/MyVideo.csv'], cores=5, clf_attr=clf_attr, print_animal_names=True)
>>> path_plotter.run()
References
- 1
Battivelli, Dorian, Lucas Boldrini, Mohit Jaiswal, Pradnya Patil, Sofia Torchia, Elizabeth Engelen, Luca Spagnoletti, Sarah Kaspar, and Cornelius T. Gross. “Induction of Territorial Dominance and Subordination Behaviors in Laboratory Mice.” Scientific Reports 14, no. 1 (November 19, 2024): 28655. https://doi.org/10.1038/s41598-024-75545-4.
Classification plotter
- class simba.plotting.plot_clf_results.PlotSklearnResultsSingleCore(config_path, video_setting=True, frame_setting=False, video_paths=None, rotate=False, animal_names=False, show_pose=True, show_bbox=False, show_confidence=False, show_gantt=None, font_size=None, space_size=None, text_opacity=None, text_thickness=None, circle_size=None, pose_palette='Set1', print_timers=True, text_clr=(255, 255, 255), text_bg_clr=(0, 0, 0))[source]
Bases:
simba.mixins.config_reader.ConfigReader,simba.mixins.train_model_mixin.TrainModelMixin,simba.mixins.plotting_mixin.PlottingMixinPlot classification results overlays on videos. Results are stored in the project_folder/frames/output/sklearn_results directory of the SimBA project.
Note
For improved run-time, see
simba.plotting.plot_clf_results_mp.PlotSklearnResultsMultiProcess()for multiprocess class. Scikit visualization documentation <https://github.com/sgoldenlab/simba/blob/master/docs/tutorial.md#step-10-sklearn-visualization__.- Parameters
config_path (Union[str, os.PathLike]) – path to SimBA project config file in Configparser format
video_setting (Optional[bool]) – If True, SimBA will create compressed videos. Default True.
frame_setting (Optional[bool]) – If True, SimBA will create individual frames. Default True.
video_file_path (Optional[str]) – Path to video file to create classification visualizations for. If None, then all the videos in the csv/machine_results will be used. Default None.
text_settings (Optional[Union[Dict[str, float], bool]]) – Dictionary holding the circle size, font size, spacing size, and text thickness of the printed text. If None, then these are autocomputed.
rotate (Optional[bool]) – If True, the output video will be rotated 90 degrees from the input. Default False.
palette (Optional[str]) – The name of the palette used for the pose-estimation key-points. Default
Set1.print_timers (Optional[bool]) – If True, the output video will have the cumulative time of the classified behaviours overlaid. Default True.
show_bbox (Optional[bool]) – If True, axis-aligned bounding boxes created from each anmals pose and displayed. Default True.
- Example
>>> text_settings = {'circle_scale': 5, 'font_size': 5, 'spacing_scale': 2, 'text_thickness': 10}
>>> test = PlotSklearnResultsSingleCore(config_path='/Users/simon/Desktop/envs/simba/troubleshooting/two_black_animals_14bp/project_folder/project_config.ini',
>>>                                       video_setting=True,
>>>                                       frame_setting=False,
>>>                                       video_file_path='Together_1.avi',
>>>                                       print_timers=True,
>>>                                       text_settings=text_settings,
>>>                                       rotate=False)
>>> test.run()
Classification plotter - multiprocess
- class simba.plotting.plot_clf_results_mp.PlotSklearnResultsMultiProcess(config_path, video_setting=True, frame_setting=False, video_paths=None, rotate=False, animal_names=False, show_pose=True, show_confidence=False, font_size=None, font=None, space_size=None, text_thickness=None, text_opacity=None, circle_size=None, pose_palette='Set1', print_timer='seconds', overwrite=True, bbox=None, time_slice=None, show_gantt=None, text_clr=(255, 255, 255), text_bg_clr=(0, 0, 0), gpu=False, verbose=True, core_cnt=- 1, data_dir=None, save_dir=None, clf_names=None)[source]
Bases:
simba.mixins.config_reader.ConfigReader,simba.mixins.train_model_mixin.TrainModelMixin,simba.mixins.plotting_mixin.PlottingMixinPlot classification results on videos using multiprocessing. Results are stored in the project_folder/frames/output/sklearn_results directory of the SimBA project.
This class creates annotated videos/frames showing classifier predictions overlaid on pose-estimation data, with optional Gantt charts, timers, and bounding boxes. Processing is parallelized across multiple CPU cores for faster rendering of large video datasets.
See also
Tutorial. For single-core processing, see
simba.plotting.plot_clf_results.PlotSklearnResultsSingleCore().- Parameters
config_path (Union[str, os.PathLike]) – Path to SimBA project config file in Configparser format.
video_setting (bool) – If True, creates compressed MP4 videos. Default True.
frame_setting (bool) – If True, saves individual annotated frames as PNG images. Default False.
video_paths (Optional[Union[List[Union[str, os.PathLike]], Union[str, os.PathLike]]]) – Path(s) to video file(s) to process. Accepts a single video file path, a list of video file paths, or a path to a directory containing videos (in which case all videos in that directory are processed). If None, processes all videos found in the project’s video directory. Default None.
rotate (bool) – If True, rotates output videos 90 degrees clockwise. Default False.
animal_names (bool) – If True, displays animal names on the video frames. Default False.
show_pose (bool) – If True, overlays pose-estimation keypoints on the video. Default True.
show_confidence (bool) – If True, displays per-frame classifier confidence values (probabilities) for each behavior. Default False.
font_size (Optional[Union[int, float]]) – Font size for text overlays. If None, auto-computed based on video resolution. Default None.
space_size (Optional[Union[int, float]]) – Vertical spacing between text lines. If None, auto-computed. Default None.
text_thickness (Optional[Union[int, float]]) – Thickness of text characters. If None, uses default. Default None.
text_opacity (Optional[Union[int, float]]) – Opacity of text background (0.0-1.0). If None, defaults to 0.8. Default None.
circle_size (Optional[Union[int, float]]) – Radius of pose keypoint circles. If None, auto-computed based on video resolution. Default None.
pose_palette (Optional[str]) – Name of color palette for pose keypoints. Must be from
simba.utils.enums.Options.PALETTE_OPTIONS_CATEGORICALorsimba.utils.enums.Options.PALETTE_OPTIONS. Default ‘Set1’.print_timer (Optional[Literal['seconds', 'hh:mm:ss.ssss']]) – Timer display mode for cumulative classifier durations.
'seconds'shows numeric seconds,'hh:mm:ss.ssss'shows clock-style timestamps with sub-second precision, andNonedisables timer display. Default'seconds'.overwrite (bool) – If True, existing output files in the target output location may be overwritten. Default True.
bbox (Optional[Literal['axis-aligned', 'animal-aligned']]) – If not None, draw bounding boxes around each animal.
'axis-aligned'= rectangle aligned with video axes;'animal-aligned'= minimum rotated rectangle aligned with the animal’s orientation. Default None (no bounding boxes).time_slice (Optional[Dict[str, str]]) – Optional time interval to render in
{'start_time': 'HH:MM:SS', 'end_time': 'HH:MM:SS'}format. If None, processes full video duration. Default None.show_gantt (Optional[int]) – If 1, appends static Gantt chart to video. If 2, appends dynamic Gantt chart that updates per frame. If None, no Gantt chart. Default None.
text_clr (Tuple[int, int, int]) – RGB color tuple for text foreground. Default (255, 255, 255) (white).
text_bg_clr (Tuple[int, int, int]) – RGB color tuple for text background. Default (0, 0, 0) (black).
gpu (bool) – If True, uses GPU acceleration for video concatenation (requires CUDA-capable GPU). Default False.
verbose (bool) – If True, prints progress and status messages during processing. Default True.
core_cnt (int) – Number of CPU cores to use for parallel processing. Pass -1 to use all available cores. Default -1.
data_dir (Optional[Union[str, os.PathLike]]) – Directory containing the classification data files (one per video, named
<video_name>.<file_type>) to overlay on the videos. If None, defaults to the project’smachine_results_dir. Default None.save_dir (Optional[Union[str, os.PathLike]]) – Directory in which to write annotated videos/frames. Created if it does not exist. If None, defaults to the project’s
sklearn_plot_dir. Default None.clf_names (Optional[Union[List[str], Tuple[str, ...]]]) – Optional subset of classifier names to visualize. Each entry must match a classifier defined in the project config. If None, all project classifiers are plotted (current behavior). Default None.
- Example
>>> clf_plotter = PlotSklearnResultsMultiProcess(
...     config_path='/Users/simon/Desktop/envs/simba/troubleshooting/beepboop174/project_folder/project_config.ini',
...     video_setting=True,
...     frame_setting=False,
...     video_paths='Trial_10.mp4',
...     rotate=False,
...     show_pose=True,
...     bbox='axis-aligned',
...     print_timers=True,
...     show_gantt=1,
...     core_cnt=5
... )
>>> clf_plotter.run()
Annotation bout plotter
- class simba.plotting.annotation_videos.PlotAnnotatedBouts(config_path, data_paths=None, animal_names=False, show_pose=True, pre_window=None, post_window=None, font_size=None, space_size=None, text_thickness=None, text_opacity=None, circle_size=None, pose_palette='Set1', clf_names=None, video_timer='hh:mm:ss.ssss', overwrite=True, bbox=None, text_clr=(255, 255, 255), text_bg_clr=(0, 0, 0), gpu=False, verbose=True, core_cnt=- 1)[source]
Bases:
simba.mixins.config_reader.ConfigReader,simba.mixins.train_model_mixin.TrainModelMixin,simba.mixins.plotting_mixin.PlottingMixinCreate per-bout annotation videos from classifier target files.
For each selected classifier and video, detected annotation bouts are exported as individual MP4 clips. Optional pre/post windows can extend each bout. The rendered clips can include pose points, animal labels, bounding boxes, and a timer overlay.
- Parameters
config_path (Union[str, os.PathLike]) – Path to the SimBA
project_config.inifile.data_paths (Optional[Union[List[Union[str, os.PathLike]], Union[str, os.PathLike]]]) – Target annotation file path(s). If
None, all target files in the project are used.animal_names (bool) – If
True, print animal names near the first body-part.show_pose (bool) – If
True, draw body-part circles.pre_window (Optional[float]) – Seconds added before each detected bout.
post_window (Optional[float]) – Seconds added after each detected bout.
font_size (Optional[Union[int, float]]) – Override auto font size.
space_size (Optional[Union[int, float]]) – Override auto vertical text spacing.
text_thickness (Optional[Union[int, float]]) – Text thickness.
text_opacity (Optional[Union[int, float]]) – Text background opacity.
circle_size (Optional[Union[int, float]]) – Pose marker radius.
pose_palette (Optional[str]) – Color palette name for pose/body-part colors.
clf_names (Optional[List[str]]) – Classifiers to visualize. If
None, all project classifiers are used.video_timer (Optional[Literal['seconds', 'hh:mm:ss.ssss']]) – Timer format to render on output frames.
overwrite (bool) – Overwrite controls for output directory handling.
bbox (Optional[Literal['axis-aligned', 'animal-aligned']]) – Optional bounding-box style to draw for each animal.
text_bg_clr (Tuple[int, int, int]) – RGB text background color.
gpu (bool) – If
Trueand an Nvidia GPU is available, enable GPU path.verbose (bool) – If
True, print progress messages.core_cnt (int) – Number of CPU cores for multiprocessing. Use
-1for all available cores.
- Example
>>> plotter = PlotAnnotatedBouts(
...     config_path='project_folder/project_config.ini',
...     data_paths=['project_folder/csv/targets_inserted/video_1.csv'],
...     clf_names=['grooming'],
...     pre_window=1.0,
...     post_window=1.0,
...     show_pose=True,
...     animal_names=False,
...     core_cnt=4
... )
>>> plotter.run()
Pose-estimation plotter
- class simba.plotting.pose_plotter_mp.PosePlotterMultiProcess(data_path, out_dir=None, palettes=None, circle_size=None, core_cnt=- 1, gpu=False, bbox=None, center_of_mass=None, sample_time=None, verbose=True)[source]
Bases:
objectCreate pose-estimation visualizations from data within a SimBA project folder using multiprocessing.
- Parameters
data_path (Union[str, os.PathLike]) – Path to a SimBA project directory containing pose-estimation data (parquet or CSV), or path to a single pose file. Must be under
project_folder/csv/so thatproject_config.inican be located.out_dir (Optional[Union[str, os.PathLike]]) – Directory where pose-estimation videos are saved. If None, saves to a new folder under the input data directory. Default None.
palettes (Optional[Dict[str, str]]) – Dict mapping animal names to color palette names (e.g.
{'Animal_1': 'Set1', 'Animal_2': 'Pastel1'}). Must have one entry per animal. If None, uses project default body-part colors. Default None.circle_size (Optional[int]) – Radius of circles drawn at each body-part location. If None, auto-computed from video resolution. Default None.
core_cnt (Optional[int]) – Number of CPU cores for multiprocessing. -1 uses all available cores. Default -1.
gpu (Optional[bool]) – If True, use GPU for video concatenation when available. Default False.
bbox (Optional[Literal['axis-aligned', 'animal-aligned']]) – If not None, draw bounding boxes around each animal.
'axis-aligned'= rectangle aligned with video axes;'animal-aligned'= minimum rotated rectangle aligned with the animal’s orientation. Default None (no bounding boxes).center_of_mass (Optional[Tuple[int, int, int]]) – If not None, RGB tuple (e.g. (255, 0, 0)) for drawing a center-of-mass dot per animal. Default None (no center of mass).
sample_time (Optional[int]) – If not None, render only the first N seconds of each video (N = this value). Useful for quick previews. Default None (full video).
verbose (bool) – If True, print progress messages during video creation. Default True.

- Example
>>> test = PosePlotterMultiProcess(data_path='project_folder/csv/outlier_corrected_movement_location', out_dir='/project_folder/test_viz', circle_size=10, core_cnt=1, palettes={'Animal_1': 'Set1', 'Animal_2': 'Pastel1'})
>>> test.run()
Skeleton video creator
- class simba.plotting.skeleton_video_creator.SkeletonVideoCreator(config_path=None, data_path=None, save_dir=None, video_info_path=None, resolution=(500, 500), bg_color=(0, 0, 0), anchor_bp=None, skeleton=None, circle_size=None, line_thickness=None, ego_anchor_1=None, ego_anchor_2=None, ego_direction=0, omit_bps=None, palette='Set1', bp_threshold=0.0, core_cnt=- 1, verbose=True)[source]
Bases:
objectCreate pose-estimation videos rendered on a solid RGB background from SimBA CSV data.
Reads outlier-corrected pose CSV files (one row per frame), extracts body-part x/y columns, and renders keypoints and optional skeleton segments on a blank canvas—no source video is required. FPS for each output file is taken from
video_info.csvfor the matching video name.Alignment modes (at most one applies; egocentric alignment takes precedence if both are set):
Egocentric (
ego_anchor_1+ego_anchor_2): rotates/translates the pose so the segment from anchor 1 → anchor 2 matchesego_direction(see parameter).Center anchor (
anchor_bponly, no egocentric anchors): each frame, shifts all keypoints soanchor_bpsits at the image center; no rotation.
Input CSVs must list body parts as
<bp>_x/<bp>_ycolumns. Optional<bp>_pprobability columns gate drawing; if any are missing, probabilities default to 1.0 for all body-parts. Skeleton edges are drawn in a fixed gray; keypoint disks usepalette.See also
PosePlotterMultiProcess— overlay pose on the original recording instead of a blank background.superimpose_overlay_video()— inset one video on another (for example, a skeleton clip over the raw recording).- Parameters
config_path (Optional[Union[str, os.PathLike]]) – Path to SimBA project
project_config.ini. If set,data_path,save_dir, andvideo_info_pathdefault from the project unless overridden. Required unless all three of those are provided explicitly.data_path (Optional[Union[str, os.PathLike]]) – Path to one pose CSV or a directory of
.csvfiles. IfNoneandconfig_pathis set, uses the project’s outlier-corrected movement directory.save_dir (Optional[Union[str, os.PathLike]]) – Directory for output
<video_name>.mp4files. IfNoneandconfig_pathis set, uses<project>/frames/output/pose_videos(created if needed).video_info_path (Optional[Union[str, os.PathLike]]) – Path to
logs/video_info.csv(fps and video names). IfNoneandconfig_pathis set, uses the project’s video info path.resolution (Tuple[int, int]) – Output size
(width, height)in pixels. Default(500, 500).bg_color (Tuple[int, int, int]) – Background color as RGB
(R, G, B), each 0–255. Default(0, 0, 0)(black).anchor_bp (Optional[str]) – Body-part name whose location is pinned to the frame center each frame (case-insensitive match to CSV names). Ignored if egocentric anchors are set. Default None.
skeleton (Optional[List[Tuple[str, str]]]) – Pairs of body-part names
(from, to)for line segments. Omitted or skipped pairs involvingomit_bps. If None, only keypoints are drawn.circle_size (Optional[int]) – Keypoint circle radius in pixels. If None, scaled from
resolution.line_thickness (Optional[int]) – Skeleton line thickness in pixels. If None, scaled from
resolution.ego_anchor_1 (Optional[str]) – First anchor body-part for egocentric alignment (e.g.
tail_base). Must be given together withego_anchor_2.ego_anchor_2 (Optional[str]) – Second anchor; together with
ego_anchor_1defines the forward axis before rotation.ego_direction (int) – Desired compass heading in degrees for the vector from
ego_anchor_1toego_anchor_2after alignment: 0 = north/up, 90 = east/right, 180 = south/down, 270 = west/left. Default 0.omit_bps (Optional[List[str]]) – Body-part names to exclude from dots and skeleton (lowercased internally).
palette (str) – Matplotlib qualitative palette name for per-body-part keypoint colors. Default
Set1.bp_threshold (float) – Minimum per-frame probability to draw a keypoint or use it in a skeleton edge. Default
0.0.core_cnt (int) – Worker processes for frame batches;
-1uses all CPUs. Default-1.verbose (bool) – Print batch and file progress. Default True.
- Raises
InvalidInputError – If neither
config_pathnor the triple (data_path,save_dir,video_info_path) is satisfactorily provided; or if only one ofego_anchor_1/ego_anchor_2is set.NoFilesFoundError – If
data_pathis not a valid file or directory.
- Example
>>> creator = SkeletonVideoCreator(
...     config_path=r'E:/project/project_config.ini',
...     resolution=(500, 500),
...     bg_color=(0, 0, 0),
...     anchor_bp='tail_base',
...     skeleton=[('nose', 'left_ear'), ('nose', 'right_ear'), ('left_ear', 'center'), ('right_ear', 'center'), ('center', 'left_side'), ('center', 'right_side'), ('center', 'tail_base'), ('tail_base', 'tail_mid'), ('tail_mid', 'tail_end')],
...     ego_anchor_1='tail_base',
...     ego_anchor_2='nose',
... )
>>> creator.run()
Classification probability plotter
- class simba.plotting.probability_plot_creator.TresholdPlotCreatorSingleProcess(config_path, data_path, clf_name, frame_setting=False, video_setting=False, last_frame=True, size=(640, 480), font_size=10, line_width=2, last_frame_as_svg=False, y_max=None, line_color='Red', line_opacity=0.8, show_thresholds=True)[source]
Bases:
simba.mixins.config_reader.ConfigReader,simba.mixins.plotting_mixin.PlottingMixinCreate classifier-probability line plots using single-process execution.
Produces one or more of: (i) frame-by-frame probability plot images, (ii) a dynamic probability-plot video, (iii) a final static probability plot (PNG or SVG).
Note
Documentation. For improved run-time, use
simba.plotting.probability_plot_creator_mp.TresholdPlotCreatorMultiprocess()
- Parameters
config_path (Union[str, os.PathLike]) – Path to SimBA project config file.
data_path (Union[List[Union[str, os.PathLike]], str, os.PathLike]) – Single machine-results file path or a list of file paths.
clf_name (str) – Classifier name to visualize.
frame_setting (bool) – If
True, save one plot image per frame. Default:False.video_setting (bool) – If
True, save a probability-plot video. Default:False.last_frame (bool) – If
True, save a final static probability plot. Default:True.size (Tuple[int, int]) – Output image/video size as
(width, height). Default:(640, 480).font_size (int) – Plot font size. Default:
10.line_width (int) – Probability line width. Default:
2.last_frame_as_svg (bool) – If
True, save final static plot as SVG; else PNG. Default:False.y_max (Optional[int]) – Fixed y-axis max. If
None, inferred from data.line_color (str) – Probability line color name. Default:
'Red'.line_opacity (float) – Probability line opacity in range (0, 1]. Default:
0.8.show_thresholds (bool) – If
True, draw horizontal threshold guide lines. Default:True.
Examples
>>> style_attr = {'width': 640, 'height': 480, 'font size': 10, 'line width': 6, 'color': 'blue', 'circle size': 20}
>>> clf_name='Attack'
>>> files_found=['/_test/project_folder/csv/machine_results/Together_1.csv']
>>> threshold_plot_creator = TresholdPlotCreatorSingleProcess(config_path='/_test/project_folder/project_config.ini', frame_setting=False, video_setting=True, last_frame=True, clf_name=clf_name, files_found=files_found, style_attr=style_attr)
>>> threshold_plot_creator.run()
Classification probability plotter - multiprocess
- class simba.plotting.probability_plot_creator_mp.TresholdPlotCreatorMultiprocess(config_path, data_path, clf_name, frame_setting=False, video_setting=False, last_frame=True, size=(640, 480), font_size=10, line_width=2, y_max=None, line_color='Red', last_frame_as_svg=False, line_opacity=0.8, cores=- 1, show_thresholds=True)[source]
Bases:
simba.mixins.config_reader.ConfigReader,simba.mixins.plotting_mixin.PlottingMixinCreate classifier-probability line plots using multiprocessing.
Produces one or more of: (i) frame-by-frame probability plot images, (ii) a dynamic probability-plot video, (iii) a final static probability plot (PNG or SVG).
- Parameters
config_path (Union[str, os.PathLike]) – Path to SimBA project config file.
data_path (Union[List[Union[str, os.PathLike]], str, os.PathLike]) – Single machine-results file path or a list of file paths.
clf_name (str) – Classifier name to visualize.
frame_setting (bool) – If
True, save one plot image per frame. Default:False.video_setting (bool) – If
True, save a probability-plot video. Default:False.last_frame (bool) – If
True, save a final static probability plot. Default:True.size (Tuple[int, int]) – Output image/video size as
(width, height). Default:(640, 480).font_size (int) – Plot font size. Default:
10.line_width (int) – Probability line width. Default:
2.y_max (Optional[Union[int, float]]) – Fixed y-axis max. If
None, inferred from data.line_color (str) – Probability line color name. Default:
'Red'.last_frame_as_svg (bool) – If
True, save final static plot as SVG; else PNG. Default:False.line_opacity (float) – Probability line opacity in range (0, 1]. Default:
0.8.cores (Optional[int]) – Number of CPU cores.
-1uses all available cores. Default:-1.show_thresholds (bool) – If
True, draw horizontal threshold guide lines. Default:True.
Note
- Example
>>> plot_creator = TresholdPlotCreatorMultiprocess(config_path='/Users/simon/Desktop/troubleshooting/train_model_project/project_folder/project_config.ini', frame_setting=True, video_setting=True, clf_name='Attack', style_attr={'width': 640, 'height': 480, 'font size': 10, 'line width': 6, 'color': 'magneta', 'circle size': 20}, cores=5)
>>> plot_creator.run()
SHAP aggregation plotter
- class simba.plotting.shap_agg_stats_visualizer.ShapAggregateStatisticsCalculator(shap_df, classifier_name, shap_baseline_value, save_dir=None, filename_suffix=None, plot=True)[source]
Bases:
objectCalculate aggregate (binned) SHAP value statistics where individual bins represent reaulated features. and create line chart visualizations reprsenting aggregations of behavior-present SHAP values.
Note

- Parameters
shap_df (pd.DataFrame) – Data with framewise SHAP values.
classifier_name (str) – Name of classifier (e.g., Attack).
shap_df – Dataframe with non-aggregated SHAP values where rows represent frames and columns represent features.
shap_baseline_value (float) – SHAP expected value (computed by
simba.train_model_functions.create_shap_log).save_dir (Optional[Union[str, os.PathLike]]) – Directory where to store the results. If None, then return the results instead of saving it.
filename_suffix (Optional[Any]) – Optional suffix to add to the shap output filenames. Useful for gridsearches and multiple shap data output files are to-be stored in the same save_dir.
plot (bool) – If True, creates a visualization of the aggregate SHAP values. Default True.
- Example
>>> shap_df = pd.read_csv('/Users/simon/Desktop/envs/simba/simba/tests/data/sample_data/shap_test.csv', index_col=0)
>>> test = ShapAggregateStatisticsCalculator(classifier_name='target',
>>>                                          shap_df=shap_df,
>>>                                          shap_baseline_value=40,
>>>                                          save_dir=None) #'/Users/simon/Desktop/feltz'
>>> dfs, img = test.run()
Single video validation plotter
- class simba.plotting.single_run_model_validation_video.ValidateModelOneVideo(config_path, feature_path, model_path, show_pose=True, show_animal_names=False, show_clf_confidence=False, font_size=None, circle_size=None, bp_palette=None, show_animal_bounding_boxes=False, text_spacing=None, text_thickness=None, text_opacity=None, discrimination_threshold=0.0, shortest_bout=0.0, create_gantt=None)[source]
Bases:
simba.mixins.config_reader.ConfigReader,simba.mixins.plotting_mixin.PlottingMixin,simba.mixins.train_model_mixin.TrainModelMixinCreate classifier validation video for a single input video with customizable visualization settings.
This class generates validation videos that overlay classifier predictions, pose estimations, and optional Gantt charts onto the original video. Results are stored in the project_folder/frames/output/validation directory.
Note
For improved run-time with multiple cores, see
simba.plotting.single_run_model_validation_video_mp.ValidateModelOneVideoMultiprocess().Video dimensions and optimal text/circle sizes are automatically calculated if not specified as a specific ratio of the image width/height.
- Parameters
config_path (Union[str, os.PathLike]) – Path to SimBA project config file in Configparser format.
feature_path (Union[str, os.PathLike]) – Path to SimBA file (parquet or CSV) containing pose-estimation and feature data.
model_path (Union[str, os.PathLike]) – Path to pickled classifier object (.sav file).
show_pose (bool) – If True, overlay pose estimation keypoints on the video. Default: True.
show_animal_names (bool) – If True, display animal names near the first body part. Default: False.
font_size (Optional[int]) – Font size for text overlays. If None, automatically calculated based on video dimensions.
circle_size (Optional[int]) – Size of pose estimation circles. If None, automatically calculated based on video dimensions.
text_spacing (Optional[int]) – Spacing between text lines. If None, automatically calculated.
text_thickness (Optional[int]) – Thickness of text overlay. If None, uses default value.
text_opacity (Optional[float]) – Opacity of text overlays (0.1-1.0). If None, defaults to 0.8.
bp_palette (Optional[str]) – Optional name of the palette to use to color the animal body-parts (e.g., Pastel1). If None,
springis used.discrimination_threshold (Optional[float]) – Classification probability threshold (0.0-1.0). Default: 0.0.
shortest_bout (Optional[int]) – Minimum classified bout length in milliseconds. Bouts shorter than this will be reclassified as absent. Default: 0.
create_gantt (Optional[Union[None, int]]) –
Gantt chart creation option:
None: No Gantt chart
1: Static Gantt chart (final frame only, faster)
2: Dynamic Gantt chart (updated per frame)
- Example
>>> # Create validation video with pose overlay and static Gantt chart
>>> validator = ValidateModelOneVideo(
...     config_path=r'/path/to/project_config.ini',
...     feature_path=r'/path/to/features.csv',
...     model_path=r'/path/to/classifier.sav',
...     show_pose=True,
...     show_animal_names=True,
...     discrimination_threshold=0.6,
...     shortest_bout=500,
...     create_gantt=1
... )
>>> validator.run()
Single video validation plotter - multiprocess
- class simba.plotting.single_run_model_validation_video_mp.ValidateModelOneVideoMultiprocess(config_path, feature_path, model_path, show_pose=True, show_animal_names=False, bbox=None, show_clf_confidence=False, font_size=None, timer_format='seconds', circle_size=None, text_spacing=None, text_thickness=None, text_opacity=None, bp_palette=None, discrimination_threshold=0.0, shortest_bout=0.0, core_cnt=- 1, create_gantt=None)[source]
Bases:
simba.mixins.config_reader.ConfigReader,simba.mixins.plotting_mixin.PlottingMixin,simba.mixins.train_model_mixin.TrainModelMixinCreate classifier validation video for a single input video using multiprocessing for improved performance.
This class generates validation videos that overlay classifier predictions, pose estimations, and optional Gantt charts onto the original video using multiple CPU cores for faster processing. Results are stored in the project_folder/frames/output/validation directory.
Note
This multiprocess version provides significant speed improvements over the single-core
simba.plotting.single_run_model_validation_video.ValidateModelOneVideoclass.- Parameters
config_path (Union[str, os.PathLike]) – Path to SimBA project config file in Configparser format.
feature_path (Union[str, os.PathLike]) – Path to SimBA file (parquet or CSV) containing pose-estimation and feature data.
model_path (Union[str, os.PathLike]) – Path to pickled classifier object (.sav file).
show_pose (bool) – If True, overlay pose estimation keypoints on the video. Default: True.
show_animal_names (bool) – If True, display animal names near the first body part. Default: False.
font_size (Optional[int]) – Font size for text overlays. If None, automatically calculated based on video dimensions.
bp_palette (Optional[str]) – Optional name of the palette to use to color the animal body-parts (e.g., Pastel1). If None,
springis used.circle_size (Optional[int]) – Size of pose estimation circles. If None, automatically calculated based on video dimensions.
text_spacing (Optional[int]) – Spacing between text lines. If None, automatically calculated.
text_thickness (Optional[int]) – Thickness of text overlay. If None, uses default value.
text_opacity (Optional[float]) – Opacity of text overlays (0.1-1.0). If None, defaults to 0.8.
discrimination_threshold (float) – Classification probability threshold (0.0-1.0). Default: 0.0.
shortest_bout (int) – Minimum classified bout length in milliseconds. Bouts shorter than this will be reclassified as absent. Default: 0.
core_cnt (int) – Number of CPU cores to use for processing. If -1, uses all available cores. Default: -1.
create_gantt (Optional[Union[None, int]]) –
Gantt chart creation option:
None: No Gantt chart
1: Static Gantt chart (final frame only, faster)
2: Dynamic Gantt chart (updated per frame)
- Example
>>> # Create multiprocess validation video with dynamic Gantt chart
>>> validator = ValidateModelOneVideoMultiprocess(
...     config_path=r'/path/to/project_config.ini',
...     feature_path=r'/path/to/features.csv',
...     model_path=r'/path/to/classifier.sav',
...     show_pose=True,
...     show_animal_names=True,
...     discrimination_threshold=0.6,
...     shortest_bout=500,
...     core_cnt=4,
...     create_gantt=2
... )
>>> validator.run()
Geometry plotter (generic)
- class simba.plotting.geometry_plotter.GeometryPlotter(geometries, video_name, config_path=None, pool=None, core_cnt=- 1, save_dir=None, thickness=None, circle_size=None, intersection_clr=None, bg_opacity=1, shape_opacity=0.3, outline_clr=None, time_slice=None, palette=None, colors=None, verbose=True)[source]
Bases:
simba.mixins.config_reader.ConfigReader,simba.mixins.plotting_mixin.PlottingMixinA class for creating overlay geometry visualization videos based on provided geometries and video name.
See also
To quickly create static geometries on a white background (useful for troubleshooting unexpected geometries), see
simba.mixins.geometry_mixin.GeometryMixin.view_shapes()andsimba.mixins.geometry_mixin.GeometryMixin.geometry_video()- Parameters
geometries (List[List[Union[Polygon, LineString, MultiPolygon, MultiLineString, Point]]]) – List of lists of geometries for each frame. Each list contains as many entries as frames. Each list may represent a track or unique tracked object.
video_name (Union[str, os.PathLike]) – Name of the input video (path or filename; if filename,
config_pathmust be provided).config_path (Optional[Union[str, os.PathLike]]) – Path to SimBA configuration file. Required when
video_nameis a filename. Default: None.pool (Optional[multiprocessing.Pool]) – Reusable process pool for parallel rendering. If None, a pool is created from
core_cnt. Default: None.core_cnt (int) – Number of CPU cores to use for parallel processing. Ignored if
poolis provided. Default: -1 (all available cores).save_dir (Optional[Union[str, os.PathLike]]) – Directory to save output videos. Required when
config_pathis None. Default: None.thickness (Optional[int]) – Thickness of geometry outlines and line strokes in pixels. Default: None (falls back to
circle_size).circle_size (Optional[int]) – Radius in pixels for Point geometries. Default: None (auto from frame size).
intersection_clr (Optional[Tuple[int, int, int]]) – BGR color for geometries that intersect another. None keeps original fill color. Default: None.
bg_opacity (Optional[float]) – Background video opacity from 0.0 to 1.0. Default: 1.0.
shape_opacity (float) – Shape fill opacity from 0.0 to 1.0. Default: 0.3.
outline_clr (Optional[Tuple[int, int, int]]) – BGR color for polygon/line outlines. None disables outlines. Default: None.
time_slice (Optional[Dict[str, str]]) – Restrict rendering to a time range. Must have keys
'start_time'and'end_time'(HH:MM:SS). Default: None.palette (Optional[str]) – Color palette name for geometries. Provide either
paletteorcolors. Default: None.colors (Optional[List[Union[str, Tuple[int, int, int]]]]) – Custom colors per geometry (names from SimBA color dict or BGR tuples). Length must match
geometries. Default: None.verbose (Optional[bool]) – Print progress information. Default: True.
- Raises
InvalidInputError – If geometries are invalid, neither palette nor colors given, or video/config/save_dir inconsistent.
CountError – If the number of shapes in the geometries does not match the number of frames in the video.
Spontaneous alternation plotter
- class simba.plotting.spontaneous_alternation_plotter.SpontaneousAlternationsPlotter(config_path, arm_names, center_name, animal_area=80, threshold=0.0, buffer=2, core_cnt=- 1, verbose=False, data_path=None)[source]
Bases:
simba.mixins.config_reader.ConfigReaderCreate plots representing delayed-alternation computations overlayed on video.
Note
Uses
simba.data_processors.spontaneous_alternation_calculator.SpontaneousAlternationCalculatorto compute alternation statistics.- Parameters
config_path (Union[str, os.PathLike]) – Path to SimBA project config file.
arm_names (List[str]) – List of ROI names representing the arms.
center_name (str) – Name of the ROI representing the center of the maze
animal_area (Optional[int]) – Value between 51 and 100, representing the percent of the animal body that has to be situated in a ROI for it to be considered an entry.
threshold (Optional[float]) – Value between 0.0 and 1.0. Body-parts with detection probabilities below this value will be (if possible) filtered when constructing the animal geometry.
buffer (Optional[int]) – Millimeters area for which the animal geometry should be increased in size. Useful if the animal geometry does not fully cover the animal.
core_cnt (Optional[int]) – The number of CPU cores to use when creating the visualization. Defaults to -1 which represents all avaialbale cores.
data_path (Optional[Union[str, os.PathLike]]) – Path to the file to be analyzed, e.g., CSV file in project_folder/csv/outlier_corrected_movement_location` directory.
- Example
>>> config_path = '/Users/simon/Desktop/envs/simba/troubleshooting/spontenous_alternation/project_folder/project_config.ini'
>>> plotter = SpontaneousAlternationsPlotter(config_path=config_path, arm_names=['A', 'B', 'C'], center_name='Center', threshold=0.0, buffer=1, animal_area=60, data_path='/Users/simon/Desktop/envs/simba/troubleshooting/spontenous_alternation/project_folder/csv/outlier_corrected_movement_location/F1 HAB.csv')
>>> plotter.run()
“Blob” plotter
- class simba.plotting.blob_plotter.BlobPlotter(data_path, gpu=False, batch_size=2000, circle_color=(147, 20, 255), save_dir=None, verbose=True, smoothing=None, circle_size=None, core_cnt=- 1)[source]
Bases:
simba.mixins.plotting_mixin.PlottingMixinPlot the results of animal tracking based on blob.
See also
simba.mixins.plotting_mixin.PlottingMixin._plot_blobs(),simba.mixins.image_mixin.ImageMixin.get_blob_locations()- param Union[List[str], str, os.PathLike] data_path
Path(s) to video file(s) or directory containing video files.
- param Optional[bool] gpu
Whether to use GPU for processing. Defaults to False.
- param Optional[int] batch_size
Number of frames to process in each batch. Defaults to 2000. Increase if your RAM allows.
- param Optional[Tuple[int, int, int]] circle_color
Color of the blobs as an RGB tuple. Defaults to pink (255, 105, 180).
- param Optional[Union[str, os.PathLike]] save_dir
Directory to save output files. If None, no files will be saved.
- param Optional[int] verbose
If True, then prints msgs informing on progress.
- param Optional[str] smoothing
Savitzky Golay, Gaussian, or None. Smooths body-part coordinate data for more accurate blob representation. Default None.
- param Optional[int] circle_size
The circle defining the x, y location of the animal in the data. Defaults to None and SimBA will try and retrieve the optimal circle size based in the video resolution.
- param Optional[int] core_cnt
The number of cores to use for multiprocessing. Deafults to -1 which means all available cores.
- example
>>> BlobPlotter(data_path=r"C: roubleshooting\RAT_NOR\project_folder
ideos est2-06-20_NOB_DOT_4_downsampled.mp4”, smoothing=’Savitzky Golay’, circle_size=10).run()
“Blob” plotter
- class simba.plotting.blob_visualizer.BlobVisualizer(data_path, video_path, save_dir, core_cnt=- 1, shape_opacity=0.5, bg_opacity=1.0, circle_size=None, hull=(178, 102, 255), anterior=(0, 0, 255), posterior=(0, 128, 0), center=(0, 165, 255), left=(255, 51, 153), right=(255, 255, 102))[source]
Bases:
objectVisualize blob tracking data by overlaying geometric shapes and body part markers on video frames.
Processes blob tracking CSV data files and corresponding videos to create annotated output videos. It can visualize multiple body parts including convex hulls, anterior (nose), posterior (tail), center points, and left/right body parts. The visualizations are rendered with customizable colors, opacity, and circle sizes.
See also
To create blob data, see
simba.video_processors.blob_tracking_executor.BlobTrackingExecutor()To import blob data into SimBA project, seesimba.pose_importers.simba_blob_importer.SimBABlobImporter()- Parameters
data_path – Path to a single CSV file or directory containing blob tracking CSV data files. CSV files must contain columns: ‘nose_x’, ‘nose_y’, ‘tail_x’, ‘tail_y’, ‘center_x’, ‘center_y’, ‘left_x’, ‘left_y’, ‘right_x’, ‘right_y’, and optionally ‘vertice_*’ columns for hull visualization.
video_path – Path to a single video file or directory containing video files. Video filenames must match the corresponding CSV data filenames (without extension).
save_dir – Directory path where annotated output videos will be saved. Directory will be created if it doesn’t exist.
core_cnt – Number of CPU cores to use for video processing. Default: -1 (auto-detect). Set to -1 to use all available cores, or specify a positive integer.
shape_opacity – Opacity of the drawn shapes (0.1-1.0). Default: 0.5. Lower values make shapes more transparent.
bg_opacity – Opacity of the background video frames (0.1-1.0). Default: 1.0. Lower values make background more transparent.
circle_size – Size of circles drawn for point markers (anterior, posterior, center, left, right). Default: None (uses default size). Set to None to use default, or specify a positive integer.
hull – RGB color tuple (R, G, B) for convex hull visualization. Default: (178, 102, 255). Set to None to disable hull visualization.
anterior – RGB color tuple (R, G, B) for anterior (nose) point visualization. Default: (0, 0, 255). Set to None to disable anterior visualization.
posterior – RGB color tuple (R, G, B) for posterior (tail) point visualization. Default: (0, 128, 0). Set to None to disable posterior visualization.
center – RGB color tuple (R, G, B) for center point visualization. Default: (0, 165, 255). Set to None to disable center visualization.
left – RGB color tuple (R, G, B) for left body part point visualization. Default: (255, 51, 153). Set to None to disable left visualization.
right – RGB color tuple (R, G, B) for right body part point visualization. Default: (255, 255, 102). Set to None to disable right visualization.
- Example
>>> visualizer = BlobVisualizer(data_path=r'/path/to/blob_data.csv',
...                             video_path=r'/path/to/video.mp4',
...                             save_dir=r'/path/to/output',
...                             core_cnt=4,
...                             shape_opacity=0.6,
...                             posterior=None,
...                             left=None,
...                             right=None)
>>> visualizer.run()
YOLO bounding-box plotter
- class simba.plotting.yolo_visualize.YOLOVisualizer(data_path, video_path, save_dir, palette='Set1', core_cnt=- 1, threshold=0.0, padding=0, pool=None, thickness=None, opacity=0.6, outline_color=None, color_by='class', verbose=True)[source]
Bases:
objectVisualize YOLO bounding-box inference results on a source video.
See also
For bounding-box inference, see
simba.model.yolo_inference.YoloInference.- Parameters
data_path (Union[str, os.PathLike]) – Path to YOLO results CSV. Expected columns:
FRAME, CLASS_ID, CLASS_NAME, CONFIDENCE, X1..Y4. Multiple rows sharing the sameFRAMEandCLASS_NAME(i.e. several detections of one class per frame, as produced byYoloInferencewithmax_per_class > 1) are rendered as separate instances, each drawn as its own polygon track and color (ordered by detection confidence).video_path (Union[str, os.PathLike]) – Path to the video from which the data was produced.
save_dir (Union[str, os.PathLike]) – Directory where to save visualization output.
palette (Optional[str]) – Matplotlib color palette name for per-class geometry colors (e.g.,
'Set1','tab10'). Default:'Set1'.core_cnt (Optional[int]) – CPU core count for parallel processing. Use
-1for all available cores.threshold (float) – Confidence threshold in
[0.0, 1.0]. Detections below threshold are masked before polygon conversion.padding (int) – Polygon offset in pixels used during multiframe bbox-to-polygon conversion for rendering. Defaults to 0 (draw the exact detection box). Positive values expand polygons outward,
-1shrinks them inward. This affects visualization geometry only, not the underlying YOLO detections in the input CSV.thickness (Optional[int]) – Polygon line thickness. If
None, default geometry plotter thickness is used.opacity (float) – Polygon fill opacity in
[0.0, 1.0]. Default: 0.6.outline_color (Optional[Tuple[int, int, int]]) – BGR color for polygon outlines. If
None, no outlines are drawn. Default: None.color_by (Literal['class', 'instance']) – How detections are colored when multiple instances per class are present.
'class'(default) gives every instance of a class the same class color (avoids color flicker, since instance slots are confidence-ranked per frame and not identity-tracked).'instance'gives each instance slot its own color (useful only when the data carries stable identities, e.g. from a tracker). For single-instance-per-class data both options are equivalent.verbose (bool) – If True, prints progress information. Default: True.
- Raises
FrameRangeError – If YOLO result frame coverage does not match video frame count.
- Example
>>> test = YOLOVisualizer(
...     data_path=r"/mnt/c/troubleshooting/yolo_inference/08102021_DOT_Rat7_8(2).csv",
...     video_path=r"/mnt/c/troubleshooting/RAT_NOR/project_folder/videos/08102021_DOT_Rat7_8(2).mp4",
...     save_dir="/mnt/c/troubleshooting/yolo_videos",
...     threshold=0.25,
...     core_cnt=4
... )
>>> test.run()
YOLO model comparator
- class simba.plotting.compare_bbox_mdls.YoloModelComparator(weights, video_path, out_dir, labels=None, threshold=0.05, device=0, batch_size=None, imgsz=None, max_detections=300, max_per_class=None, palette='Set1', opacity=0.6, thickness=2, padding=0, outline_color=None, color_by='class', core_cnt=None, gpu=False, overwrite=True, overlay_labels=True, time_window=None, verbose=True)[source]
Bases:
objectCompare two or more YOLO models side-by-side on a set of test videos.
Per-model CSV detections and visualization videos are written to``out_dir/<label>/`` and the final comparison videos to
out_dir/compare/.See also
YoloInference(per-model inference)YOLOVisualizer(per-model rendering)horizontal_video_concatenator()(side-by-side concat)- Parameters
weights (List[Union[str, os.PathLike]]) – List of YOLO model weight paths (length >= 2).
video_path (Union[str, os.PathLike, List[Union[str, os.PathLike]]]) – One of: a single video file path; a directory of videos (searched non-recursively); or a list/tuple of video file paths.
out_dir (Union[str, os.PathLike]) – Output directory. Per-model CSV/viz subdirectories and a
compare/subdirectory are created underneath.labels (Optional[List[str]]) – Display labels (one per model). If None, the weight file name (without extension) of each model is used. Must be unique and match
len(weights).threshold (float) – YOLO detection confidence threshold in
[0.0, 1.0].device (Union[Literal['cpu'], int]) – Inference device (‘cpu’ or CUDA index).
batch_size (Optional[int]) – Frames per YOLO inference batch. If None, it is read per-model from the model metadata (required for
.enginefiles); falls back to 400 when unavailable (e.g..ptweights).imgsz (Optional[int]) – Model inference image size. If None, it is read per-model from the model metadata; falls back to 320 when unavailable. For
.enginefiles the engine’s baked-in image size always wins (a mismatching explicit value is overridden with a warning).max_detections (int) – Maximum detections per frame (total, across all classes) returned by each model.
max_per_class (Optional[int]) – Maximum number of detections to retain per class per frame. E.g., if one ‘resident’ and one ‘intruder’ is expected, set this to 1. Defaults to None, meaning all detected instances of each class are retained (up to
max_detections). Passed through to each model’sYoloInference.palette (Optional[str]) – Matplotlib palette passed to
YOLOVisualizer.opacity (float) – Polygon fill opacity in
[0.0, 1.0]for the visualization.thickness (Optional[int]) – Polygon line thickness.
padding (int) – Polygon offset in pixels for the visualization. Defaults to 0 (draw the exact detection box). Positive values expand polygons outward,
-1shrinks them inward.outline_color (Optional[Tuple[int, int, int]]) – BGR outline color for polygons.
color_by (Literal['class', 'instance']) – Passed to
YOLOVisualizer.'class'(default) colors every instance of a class the same (avoids color flicker whenmax_per_class > 1, since instances are confidence-ranked per frame, not identity-tracked);'instance'colors each instance slot separately. Equivalent for single-instance data.core_cnt (Optional[int]) – CPU core count for the visualizer. If None, defaults to a quarter of the available cores to leave headroom;
-1= all cores.gpu (bool) – Use the NVENC codec when concatenating side-by-side.
overwrite (bool) – If True (default), always re-render comparison videos. If False, skip videos whose comparison output already exists.
overlay_labels (bool) – If True, burns each model’s
labelinto the top-left corner of its panel before side-by-side concatenation, so the panels are self-describing.time_window (Optional[Dict[str, str]]) – Analysis window as a dict with
'start'and'end'keys, both inHH:MM:SSformat (e.g.{'start': '00:00:05', 'end': '00:00:30'}). If provided, each video is clipped to the window (saved underout_dir/clips/) and the comparison runs on the clip. If None, the full video is analysed.verbose (bool) – Print progress information.
- Example
>>> c = YoloModelComparator(
...     weights=[r"/mdl/train8/weights/best.pt", r"/mdl/train13/weights/best.pt"],
...     video_path=r"/test_videos",
...     out_dir=r"/yolo_comparison",
...     labels=["train8", "train13"],
...     threshold=0.05,
...     max_detections=1,
...     device=0,
... )
>>> c.run()
Plotting methods
- class simba.mixins.plotting_mixin.PlottingMixin[source]
Bases:
objectMethods for visualizations
- static categorical_scatter(data, columns=('X', 'Y', 'Cluster'), palette='Set1', show_box=False, size=10, title=None, save_path=None)[source]
Create a 2D scatterplot with a categorical legend.
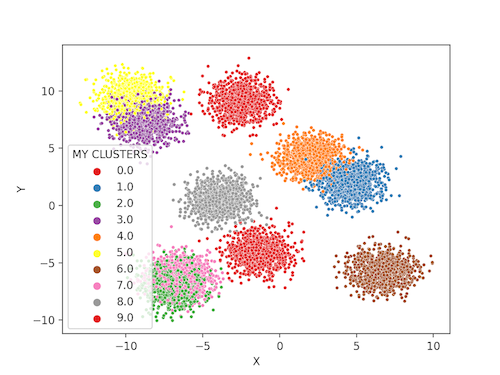
- Parameters
data (Union[np.ndarray, pd.DataFrame]) – Input data, either a NumPy array or a pandas DataFrame.
columns (Optional[List[str]]) – A list of column names for the x-axis, y-axis, and the categorical variable respectively. Default is [“X”, “Y”, “Cluster”].
palette (Optional[str]) – The color palette to be used for the categorical variable. Default is “Set1”.
show_box (Optional[bool]) – Whether to display the plot axis. Default is False.
size (Optional[int]) – Size of markers in the scatterplot. Default is 10.
title (Optional[str]) – Title for the plot. Default is None.
save_path (Optional[Union[str, os.PathLike]]) – The path where the plot will be saved. Default is None which returns the image.
- Return matplotlib.axes._subplots.AxesSubplot or None
The scatterplot if ‘save_path’ is not provided, otherwise None.
- static continuous_scatter(data, columns=('X', 'Y', 'Cluster'), palette='magma', show_box=False, size=10, title=None, bg_clr=None, save_path=None)[source]
Create a 2D scatterplot with a continuous legend
- create_gantt_img(bouts_df, clf_name, image_index, fps, gantt_img_title, header_font_size=24, label_font_size=12)[source]
Helper to create a single gantt plot based on the data preceeding the input image
- Parameters
bouts_df (pd.DataFrame) – ataframe holding information on individual bouts created by
simba.misc_tools.get_bouts_for_gantt().clf_name (str) – Name of the classifier.
image_index (int) – The count of the image. E.g.,
1000will create a gantt image representing frame 1-1000.fps (int) – The fps of the input video.
gantt_img_title (str) – Title of the image.
:return np.ndarray
- create_single_color_lst(pallete_name, increments, as_rgb_ratio=False, as_hex=False)[source]
Helper to create a color palette of bgr colors in a list.
- Parameters
:return list
Note
If as_rgb_ratio AND as_hex, then returns HEX.
- static draw_lines_on_img(img, start_positions, end_positions, color, opacity=None, highlight_endpoint=False, thickness=2, circle_size=2)[source]
Helper to draw a set of lines onto an image.
- Parameters
img (np.ndarray) – The image to draw the lines on.
start_positions (np.ndarray) – 2D numpy array representing the start positions of the lines in x, y format.
end_positions (np.ndarray) – 2D numpy array representing the end positions of the lines in x, y format.
color (Tuple[int, int, int]) – The color of the lines in BGR format.
highlight_endpoint (Optional[bool]) – If True, highlights the ends of the lines with circles.
thickness (Optional[int]) – The thickness of the lines.
circle_size (Optional[int]) – If
highlight_endpointis True, the size of the highlighted points.
- Return np.ndarray
The image with the lines overlayed.
- get_bouts_for_gantt(data_df, clf_name, fps)[source]
Helper to detect all behavior bouts for a specific classifier.
- get_optimal_circle_size(frame_size, circle_frame_ratio=100)[source]
Calculate the optimal circle size for fitting within a rectangular frame based on a given ratio.
This method computes the diameter of a circle that fits within the smallest dimension of a rectangular frame, scaled by a specified ratio. The resulting circle size ensures that it fits within the bounds of the frame while maintaining the specified size ratio.
- Parameters
frame_size (Tuple[int, int]) – A tuple representing the dimensions of the rectangular frame (width, height).
circle_frame_ratio (Optional[int]) – An integer representing the ratio between the frame’s smallest dimension and the circle’s diameter. A lower ratio results in a larger circle, and a higher ratio results in a smaller circle.
- Return int
The computed diameter of the circle that fits within the smallest dimension of the frame, scaled by the circle_frame_ratio.
- get_optimal_font_scales(text, accepted_px_width, accepted_px_height, text_thickness=2, font=4)[source]
Get the optimal font size, column-wise and row-wise text distance of printed text for printing on images.
- Parameters
text (str) – The text to be printed. Either a string or a list of strings. If a list, then the longest string will be used to evaluate spacings/font.
accepted_px_width (int) – The widest allowed string in pixels. E.g., 1/4th of the image width.
accepted_px_height (int) – The highest allowed string in pixels. E.g., 1/10th of the image size.
text_thickness (Optional[int]) – The thickness of the font. Default: 2.
font (Optional[int]) – The font integer representation 0-7. See ``simba.utils.enums.Options.CV2_FONTS.values
- Return Tuple[int, int, int]
The font size, the shift on x between successive columns, the shift in y between successive rows.
- Example
>>> img = cv2.imread('/Users/simon/Desktop/Screenshot 2024-07-08 at 4.46.03 PM.png')
>>> accepted_px_width = int(img.shape[1] / 4)
>>> accepted_px_height = int(img.shape[0] / 10)
>>>>text = 'HELLO MY FELLOW'
>>> PlottingMixin().get_optimal_font_scales(text=text, accepted_px_width=accepted_px_width, accepted_px_height=accepted_px_height, text_thickness=2)
- static get_optimal_font_size_ttf(text, font_path, accepted_px_width, accepted_px_height, max_px=400)[source]
Get the optimal font PIXEL size, column-wise and row-wise text distance for printing text on images using a TrueType/OpenType (.ttf/.otf) font rendered with PIL.
This is the TTF counterpart of
get_optimal_font_scales(). Note that the returned value is a font PIXEL size (to be passed asfont_sizetoput_text()together withfont_path), NOT the cv2 scale factor returned byget_optimal_font_scales(). The two are not interchangeable.- Parameters
text (Union[str, List[str]]) – The text to be printed. Either a string or a list of strings. If a list, then the longest string will be used to evaluate spacings/font.
font_path (str) – Path to the .ttf/.otf font file to measure with.
accepted_px_width (int) – The widest allowed string in pixels. E.g., 1/4th of the image width.
accepted_px_height (int) – The highest allowed string in pixels. E.g., 1/10th of the image size.
max_px (int) – The largest font pixel size to consider. The search counts down from this value. Default: 400.
- Return Tuple[int, int, int]
The font pixel size, the shift on x between successive columns, the shift in y between successive rows.
- Example
>>> size_px, x_shift, y_shift = PlottingMixin.get_optimal_font_size_ttf(text='HELLO MY FELLOW', font_path='Poppins-Regular.ttf', accepted_px_width=480, accepted_px_height=108)
- static get_optimal_font_spacing_ttf(font_path, size_px, text, gap=1)[source]
Return the optimal vertical pixel pitch (distance between consecutive baselines) for stacking lines of TTF text rendered by
put_text(), so the per-line background boxes sit snugly without overlapping.The pitch equals the tallest rendered box height of the actual
textbeing drawn (i.e. the tight ascender-to-descender bbox of the supplied strings atsize_px, plus the same padding thatput_text()adds to its background box), plus a smallgap. Measuring the real text - rather than a worst-case probe - keeps caps-only stacks tight (no wasted descender room) while still accommodating descenders when present. This is the row-spacing counterpart to the font PIXEL size returned byget_optimal_font_size_ttf(); do not use the cv2 spacing fromget_optimal_font_scales()for TTF text, as the metrics differ.- Parameters
font_path (str) – Path to the .ttf/.otf font file.
size_px (int) – Font pixel height (as passed to
put_text()whenfont_pathis set).text (Union[str, List[str]]) – The string(s) that will be stacked. The tallest rendered box across them sets the pitch.
gap (int) – Extra pixels inserted between consecutive line boxes. Default 1.
- Return int
The recommended vertical pitch in pixels.
- Example
>>> PlottingMixin.get_optimal_font_spacing_ttf(font_path='Poppins Regular.ttf', size_px=13, text=['TIMERS:', 'grooming'])
- static get_path_img(data, size=None, line_thickness=2, line_color=(147, 20, 255), bg_clr=(255, 255, 255), opacity=1.0, smoothing_time=None, save_path=None, svg=False, dpi=500)[source]
Create a path plot from NumPy array data.
Generates a path visualization with optional time or velocity-based coloring, background images, smoothing, and SVG/PNG output.
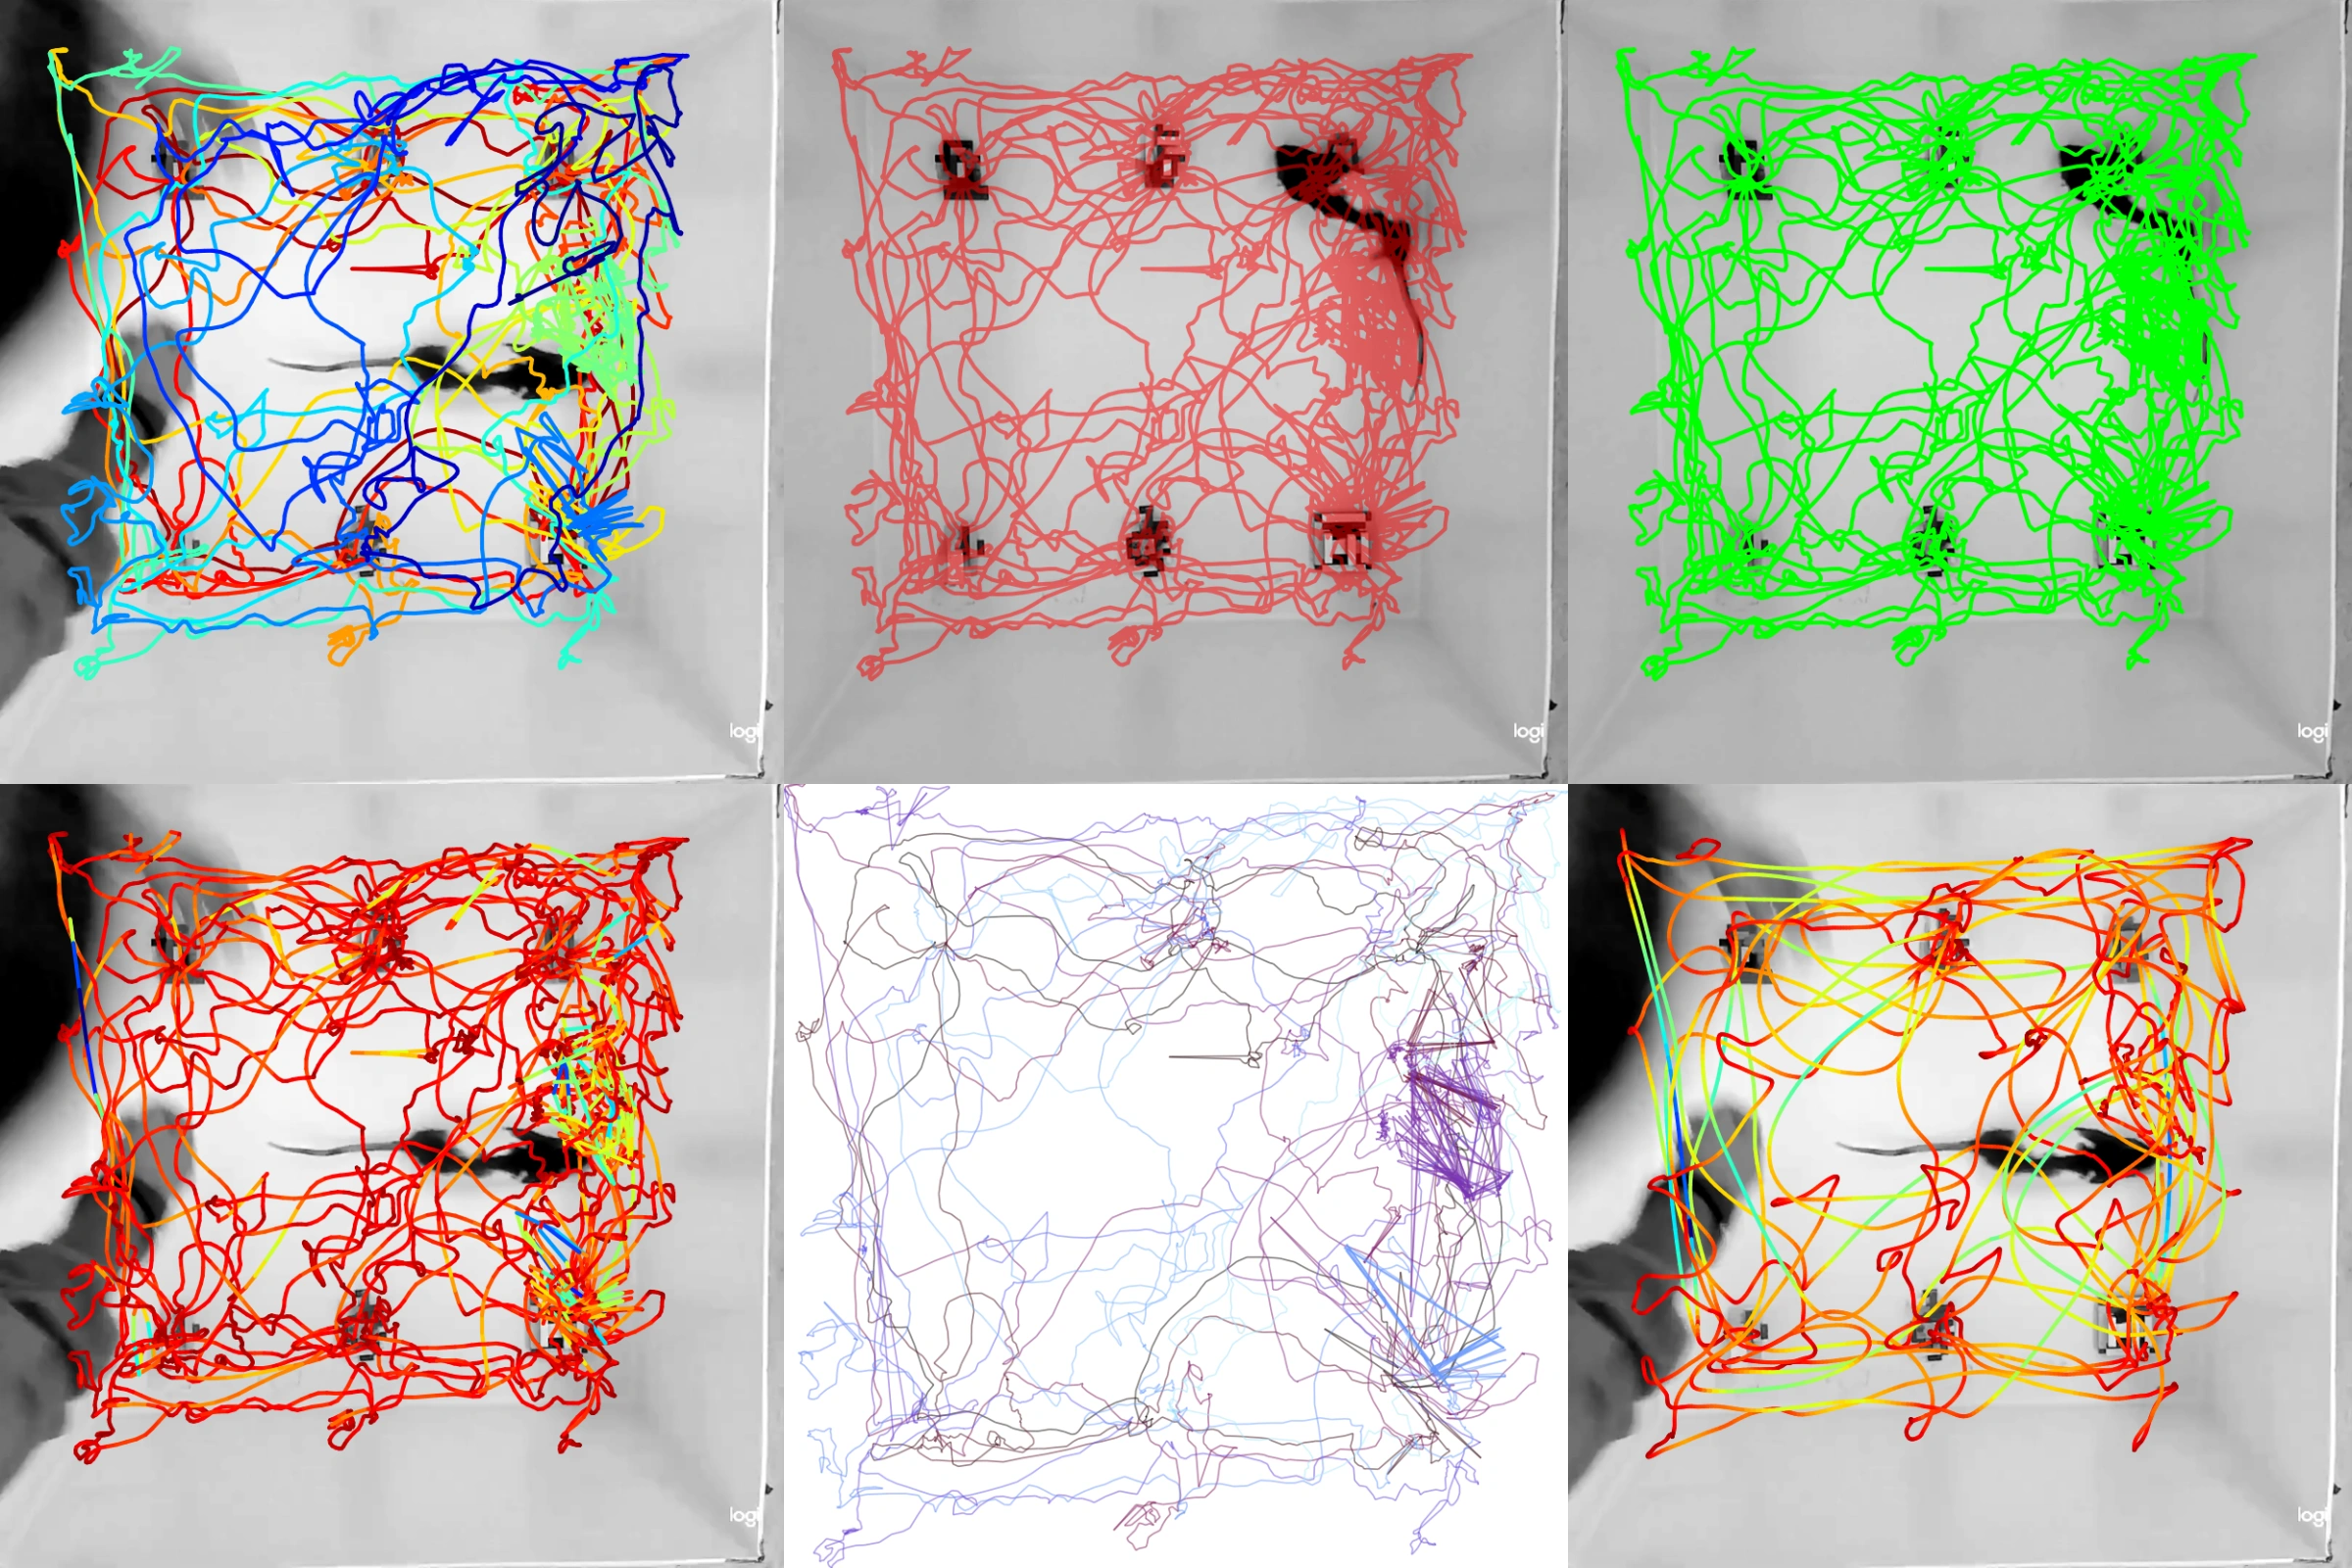
- Parameters
data (np.ndarray) – 2D array with shape (N, 2) containing x, y coordinates.
size (Optional[Tuple[int, int]]) – Image size as (height, width) in pixels. If None, auto-calculated from data or bg_img.
line_thickness (float) – Thickness of the path line. Default: 2.
line_color (Tuple[int, int, int]) – RGB color tuple (0-255). Default: (147, 20, 255).
bg_clr (Tuple[int, int, int]) – Background color RGB tuple (0-255). Default: (255, 255, 255).
bg_img (Optional[np.ndarray]) – Background image array. If provided, overrides bg_clr. Default: None.
opacity (float) – Line opacity (0.0-1.0). Default: 1.0.
smoothing_time (Optional[int]) – Smoothing time window in milliseconds. Applies Savitzky-Golay filter. If None, no smoothing. Default: None.
color_by (Optional[Literal['time', 'velocity']]) – Color path by time progression or velocity. If None, uses line_color. Default: None.
save_path (Optional[Union[str, os.PathLike]]) – Path to save the image. If None, returns figure.
svg (bool) – If True, saves as SVG format. If False, saves as PNG. Default: False.
dpi (int) – Resolution for saved images. Default: 500.
- Return Optional[matplotlib.figure.Figure]
Returns matplotlib figure if save_path is None, otherwise None.
See also
For more complex path plots with multiprocessing and advanced features, see
simba.plotting.path_plotter.PathPlotterSingleCoreandsimba.plotting.path_plotter_mp.PathPlotterMulticore.- Example
>>> df = pd.read_csv('/Users/simon/Desktop/envs/simba/troubleshooting/RAT_NOR/project_folder/csv/outlier_corrected_movement_location/2022-06-20_NOB_DOT_4.csv')
>>> data = df[['Nose_x', 'Nose_y']].values
>>> img = read_frm_of_video(video_path='/Users/simon/Desktop/envs/simba/troubleshooting/RAT_NOR/project_folder/videos/2022-06-20_NOB_DOT_4.mp4', frame_index=400)
>>> PlottingMixin().get_path_img(data=data,
>>>          size=(1080, 1080),
>>>          line_thickness=0.5,
>>>          line_color=(0, 255, 0),
>>>          bg_clr=(255, 255, 255),
>>>          bg_img=img,
>>>          save_path='/Users/simon/Desktop/envs/simba/troubleshooting/RAT_NOR/project_folder/csv/outlier_corrected_movement_location/2022-06-20_NOB_DOT_4_3.png',
>>>          dpi=600,
>>>          opacity=1.0,
>>>          color_by=None,
>>>          svg=False,
>>>          smoothing_time=5000)
- static insert_directing_line(directing_df, img, shape_name, animal_name, frame_id, color=(0, 0, 255), thickness=2, style='lines')[source]
Helper to insert lines between the actor ‘eye’ and the ROI centers.
- Parameters
directing_df – Dataframe containing eye and ROI locations. Stored as
resultsin instance ofsimba.roi_tools.ROI_directing_analyzer.DirectingROIAnalyzer.img (np.ndarray) – The image to draw the line on.
shape_name (str) – The name of the shape to draw the line to.
animal_name (str) – The name of the animal
frame_id (int) – The frame number in the video
color (Optional[Tuple[int]]) – The color of the line
thickness (Optional[int]) – The thickness of the line.
style (Optional[str]) – The style of the line. “lines” or “funnel”.
- Return np.ndarray
The input image with the line.
- static joint_plot(data, columns=('X', 'Y', 'Cluster'), palette='Set1', kind='scatter', size=10, title=None, save_path=None)[source]
Generate a joint plot.
Useful when visualizing embedded behavior data latent spaces with dense and overlapping scatters.

- Parameters
data (Union[np.ndarray, pd.DataFrame]) – Input data, either a NumPy array or a pandas DataFrame.
columns (Optional[List[str]]) – Names of columns if input is dataframe, default is [“X”, “Y”, “Cluster”].
palette (Optional[str]) – Palette for the plot, default is “Set1”.
kind (Optional[str]) – Type of plot (“scatter”, “kde”, “hist”, or “reg”), default is “scatter”.
size (Optional[int]) – Size of markers for scatter plot, default is 10.
title (Optional[str]) – Title of the plot, default is None.
save_path (Optional[Union[str, os.PathLike]]) – Path to save the plot image, default is None.
- Return sns.JointGrid or None
JointGrid object if save_path is None, else None.
- Example
>>> data, lbls = make_blobs(n_samples=100000, n_features=2, centers=10, random_state=42)
>>> data = np.hstack((data, lbls.reshape(-1, 1)))
>>> PlottingMixin.joint_plot(data=data, columns=['X', 'Y', 'Cluster'], title='The plot')
- static line_plot(df, x, y, error=None, x_label=None, y_label=None, title=None, fig_size=(10, 6), error_opacity=0.2, palette='Set1', grid=True, bg_clr='white', line_width=1.5, line_opacity=1.0, save_path=None, dpi=None, tight_layout=True, show_legend=True, legend_loc='best', font_size=None, title_font_size=None, x_lim=None, y_lim=None, marker=None, markersize=None, linestyle=None, save_kwargs=None, svg=False, x_tick_lbl_rotation=None, x_tick_interval=None)[source]
Line plot from DataFrame with optional error bands.
Optional styling arguments (useful for publication or clearer plots): - dpi: Resolution for saved figure (e.g. 150, 300). Ignored when svg=True. - tight_layout: If True, call fig.tight_layout() before save (default True). - show_legend: Whether to show the legend (default True). - legend_loc: Legend position, e.g. ‘best’, ‘upper right’, ‘lower left’. - font_size: Font size for axis labels and tick labels. - title_font_size: Font size for the title (default 15 if title set). - x_lim, y_lim: (min, max) tuples to fix axis limits. - marker: Matplotlib marker for data points (e.g. ‘o’, ‘s’, ‘^’). - markersize: Size of markers when marker is set. - linestyle: Single style or list of styles per series (‘-’, ‘–’, ‘-.’, ‘:’). - save_kwargs: Dict passed to plt.savefig (e.g. bbox_inches=’tight’, pad_inches=0.1). - svg: If True and save_path is set, save as SVG (path extension becomes .svg).
- make_distance_plot(data, line_attr, style_attr, fps, save_img=False, save_path=None)[source]
Helper to make a single line plot .png image with N lines.
- Parameters
data (np.array) – Two-dimensional array where rows represent frames and columns represent intertwined x and y coordinates.
line_attr (dict) – Line color attributes.
style_attr (dict) – Plot attributes (size, font size, line width etc).
fps (int) – Video frame rate.
save_path (Optionan[str]) – Location to store output .png image. If None, then return image.
- Example
>>> fps = 10
>>> data = np.random.random((100,2))
>>> line_attr = {0: ['Blue'], 1: ['Red']}
>>> save_path = '/_tests/final_frm.png'
>>> style_attr = {'width': 640, 'height': 480, 'line width': 6, 'font size': 8, 'y_max': 'auto'}
>>> self.make_distance_plot(fps=fps, data=data, line_attr=line_attr, style_attr=style_attr, save_path=save_path)
- make_gantt_plot(bouts_df, clf_names, palette, fps, x_length, video_name, width=640, height=480, font_size=8, bar_opacity=0.85, font_rotation=45, x_tick_lbl_rotation=45, font=None, title=None, title_font_size=24, save_path=None, edge_clr='black', hhmmss=False, as_svg=False)[source]
Create a Gantt chart visualization of behavioral bouts over time.
Generates a horizontal bar chart where each row represents a behavior class, and bars indicate when behaviors occurred. Supports SVG output for scalable figures or PNG/NumPy array for video overlays.
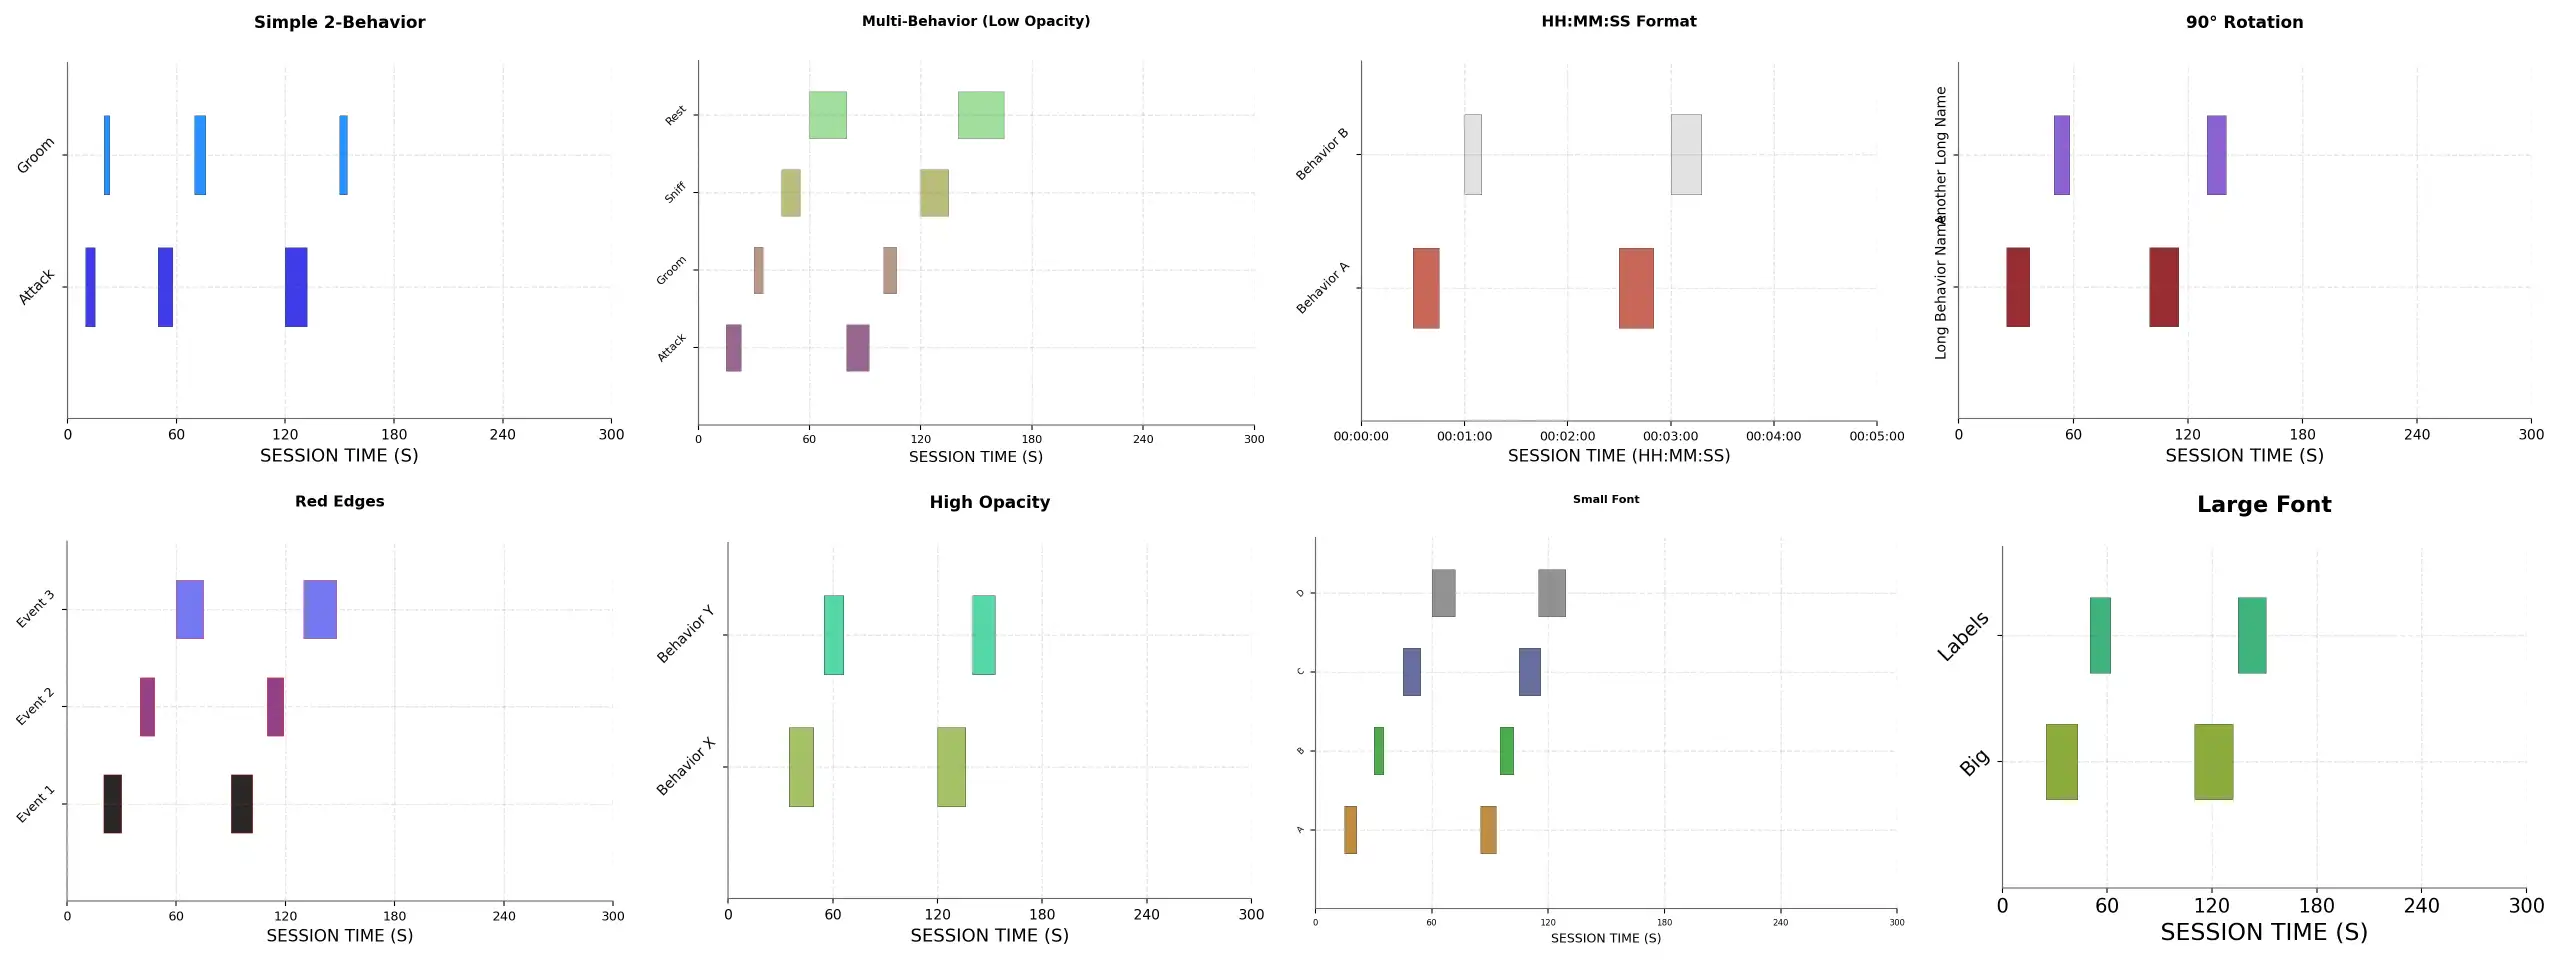
- Parameters
bouts_df (pd.DataFrame) – DataFrame containing bout data with columns ‘Event’, ‘Start_time’, and ‘Bout_time’.
clf_names (List[str]) – List of behavior/classifier names to display. Must match ‘Event’ values in
bouts_df.palette (List[Tuple[int, int, int]]) – List of RGB color tuples (0-255) for each behavior. Length should match
clf_names.fps (int) – Frames per second of the source video. Used to convert frame counts to time.
x_length (int) – Total length of the session in frames. Determines x-axis range.
video_name (str) – Title displayed at the top of the chart.
width (int) – Output image width in pixels (when not SVG). Default: 640.
height (int) – Output image height in pixels (when not SVG). Default: 480.
font_size (int) – Base font size for labels and ticks. Default: 8.
bar_opacity (float) – Opacity of behavior bars (0.0-1.0). Default: 0.85.
font_rotation (int) – Rotation angle in degrees for y-axis labels. Default: 45.
x_tick_lbl_rotation (int) – Rotation angle in degrees for x-axis tick labels. Default: 0.
font (Optional[str]) – Font to render the chart text in. Accepts a bundled SimBA font name (the .ttf filename stem returned by
get_named_simba_fonts(), e.g. ‘Poppins Regular’), an OS-installed font name (fromget_fonts()), or any matplotlib family name. Bundled fonts are auto-registered with matplotlib and resolved to their internal family name. If None, uses the matplotlib default.save_path (Optional[str]) – Path to save the image. If None and
as_svg=False, returns NumPy array.edge_clr (Optional[str]) – Color of bar edges. Default: ‘black’.
hhmmss (bool) – If True, displays x-axis time as HH:MM:SS. If False, displays seconds. Default: False.
as_svg (bool) – If True, returns or saves SVG format. If False, uses PNG format. Default: False.
- Return Union[None, np.ndarray, str]
If
as_svg=Trueandsave_path=None, returns SVG string. Ifsave_pathprovided, returns None (saves file). Otherwise returns NumPy array (BGR format).
- static make_line_plot(data, colors, show_box=True, width=640, height=480, line_width=6, font_size=8, bg_clr=None, x_lbl_divisor=None, title=None, y_lbl=None, x_lbl=None, y_tick_lbls_as_int=False, x_tick_lbls_as_int=False, y_tick_cnt=10, x_tick_cnt=5, y_max=- 1, line_opacity=1.0, as_svg=False, save_path=None, show_thresholds=False)[source]
Create a multi-line plot from NumPy arrays.
Generates a line plot with one or more data series, each with customizable colors and styling. Supports SVG output for scalable figures or PNG/NumPy array for video overlays.
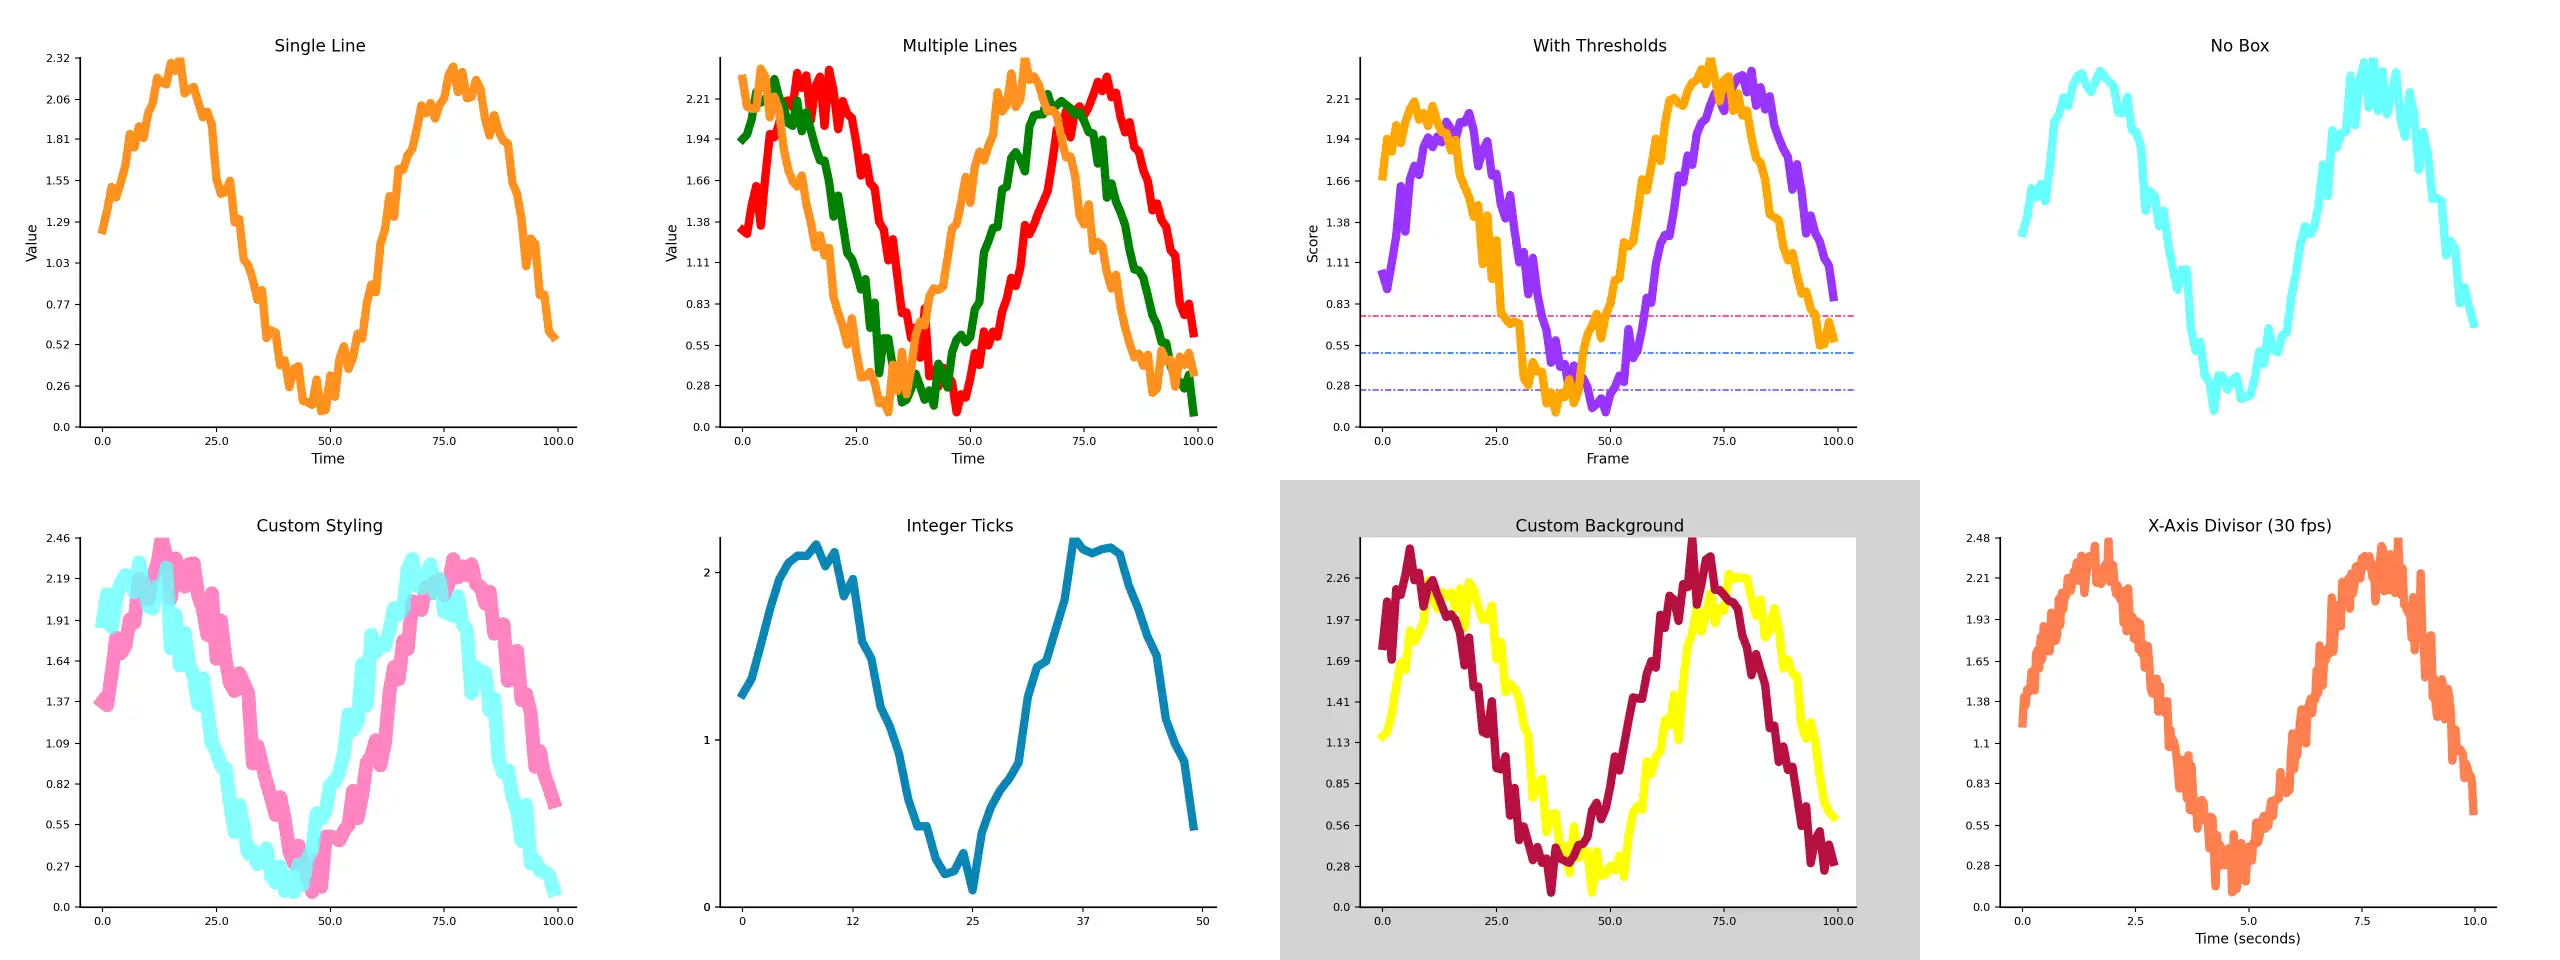
- Parameters
data (List[np.ndarray]) – List of 1D or 2D NumPy arrays to plot. Each array becomes one line.
colors (List[str]) – List of color names (must match length of
data). Uses SimBA color dictionary.show_box (Optional[bool]) – If False, hides plot axes and borders. Default: True.
width (Optional[int]) – Output image width in pixels (when not SVG). Default: 640.
height (Optional[int]) – Output image height in pixels (when not SVG). Default: 480.
line_width (Optional[int]) – Width of plotted lines. Default: 6.
font_size (Optional[int]) – Font size for labels and ticks. Default: 8.
bg_clr (Optional[str]) – Background color name. If None, uses matplotlib default.
x_lbl_divisor (Optional[float]) – Divide x-axis tick labels by this value (e.g., convert frames to seconds). Default: None.
title (Optional[str]) – Plot title displayed at top.
y_lbl (Optional[str]) – Y-axis label.
x_lbl (Optional[str]) – X-axis label.
y_tick_lbls_as_int (bool) – If True, formats y-axis ticks as integers. Default: False.
x_tick_lbls_as_int (bool) – If True, formats x-axis ticks as integers. Default: False.
y_tick_cnt (int) – Number of y-axis tick marks. Default: 10.
x_tick_cnt (int) – Number of x-axis tick marks. Default: 5.
y_max (Optional[Union[int, float]]) – Maximum y-axis value. If -1, auto-scales to data maximum. Default: -1.
line_opacity (Optional[float]) – Opacity of lines (0.0-1.0). Default: 1.0.
as_svg (bool) – If True, returns or saves SVG format. If False, uses PNG format. Default: False.
save_path (Optional[Union[str, os.PathLike]]) – Path to save the image. If None and
as_svg=False, returns NumPy array.show_thresholds (bool) – If True, displays horizontal threshold lines at 25%, 50%, and 75%. Default: False.
- Return Union[None, np.ndarray, str]
If
as_svg=Trueandsave_path=None, returns SVG string. Ifsave_pathprovided, returns None (saves file). Otherwise returns NumPy array (BGR format).
- static make_line_plot_plotly(data, colors, show_box=True, show_grid=False, width=640, height=480, line_width=6, font_size=8, bg_clr='white', x_lbl_divisor=None, title=None, y_lbl=None, x_lbl=None, y_max=- 1, line_opacity=0.5, save_path=None)[source]
Create a line plot using Plotly.
Note
Plotly can be more reliable than matplotlib on some systems when accessed through multprocessing calls.
If not called though multiprocessing, consider using
simba.mixins.plotting_mixin.PlottingMixin.make_line_plot()Uses
kaleidofor transform image to numpy array or save to disk.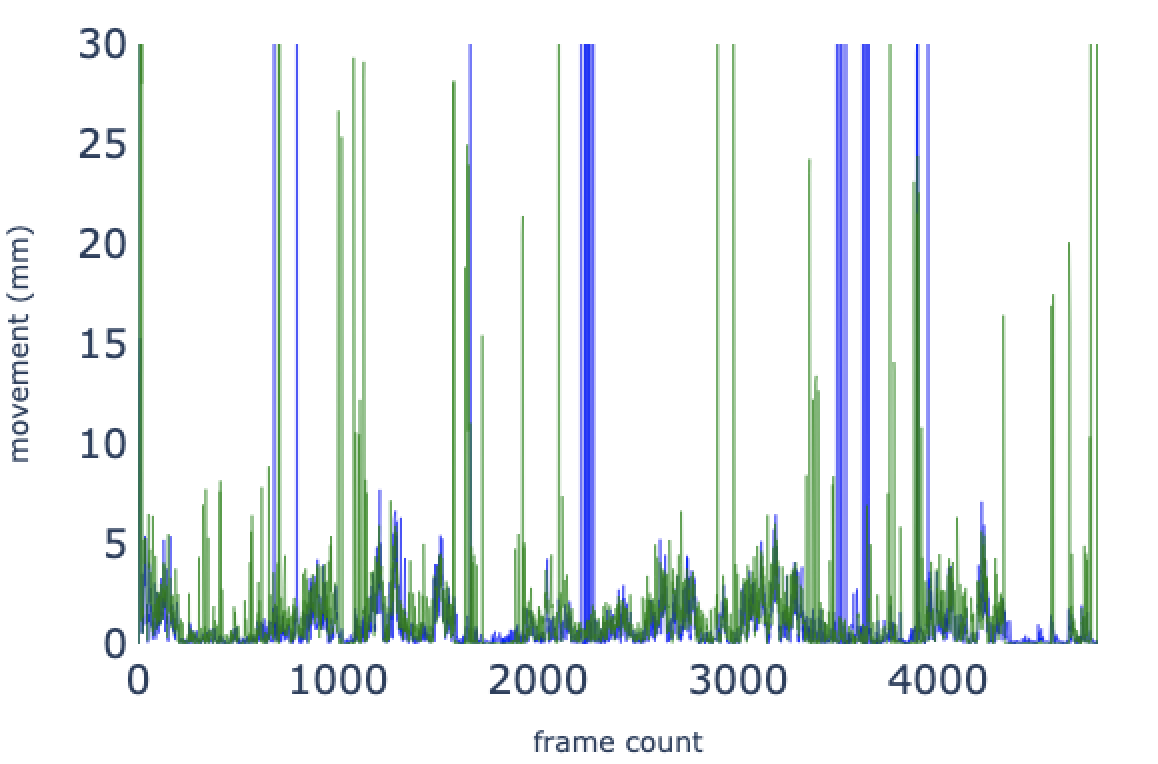
- Parameters
data (List[np.ndarray]) – List of 1D numpy arrays representing lines.
colors (List[str]) – List of named colors of size len(data).
show_box (bool) – Whether to show the plot box (axes, title, etc.).
show_grid (bool) – Whether to show gridlines on the plot.
width (int) – Width of the plot in pixels.
height (int) – Height of the plot in pixels.
line_width (int) – Width of the lines in the plot.
font_size (int) – Font size for axis labels and tick labels.
bg_clr (str) – Background color of the plot.
x_lbl_divisor (float) – Divisor for adjusting the tick spacing on the x-axis.
title (str) – Title of the plot.
y_lbl (str) – Label for the y-axis.
x_lbl (str) – Label for the x-axis.
y_max (int) – Maximum value for the y-axis.
line_opacity (float) – Opacity of the lines in the plot.
save_path (Union[str, os.PathLike]) – Path to save the plot image. If None, returns a numpy array of the plot.
- Returns
If save_path is None, returns a numpy array representing the plot image.
- Example
>>> p = np.random.randint(0, 50, (100,))
>>> y = np.random.randint(0, 50, (200,))
>>> img = PlottingMixin.make_line_plot_plotly(data=[p, y], show_box=False, font_size=20, bg_clr='white', show_grid=False, x_lbl_divisor=30, colors=['Red', 'Green'], save_path='/Users/simon/Desktop/envs/simba/troubleshooting/beepboop174/project_folder/frames/output/line_plot/Trial     3_final_img.png')
- static make_path_plot(data, colors, width=640, height=480, max_lines=None, bg_clr=(255, 255, 255), circle_size=3, font_size=2.0, font_thickness=2, line_width=2, animal_names=None, clf_attr=None, save_path=None)[source]
Creates a path plot visualization from the given data.

- Parameters
data (List[np.ndarray]) – List of numpy arrays containing path data.
colors (List[Tuple[int, int, int]]) – List of RGB tuples, strings (names of palettes), or lists of list of tuples, representing colors for each path.
width – Width of the output image (default is 640 pixels).
height – Height of the output image (default is 480 pixels).
max_lines – Maximum number of lines to plot from each path data.
bg_clr – Background color of the plot (default is white).
circle_size – Size of the circle marker at the end of each path (default is 3).
font_size – Font size for displaying animal names (default is 2.0).
font_thickness – Thickness of the font for displaying animal names (default is 2).
line_width – Width of the lines representing paths (default is 2).
animal_names – List of names for the animals corresponding to each path.
clf_attr – Dictionary containing attributes for classification markers.
save_path – Path to save the generated plot image.
- Returns
If save_path is None, returns the generated image as a numpy array, otherwise, returns None.
- Example
>>> x = np.random.randint(0, 500, (100, 2))
>>> y = np.random.randint(0, 500, (100, 2))
>>> position_data = np.random.randint(0, 500, (100, 2))
>>> clf_data_1 = np.random.randint(0, 2, (100,))
>>> clf_data_2 = np.random.randint(0, 2, (100,))
>>> clf_data = {'Attack': {'color': (155, 1, 10), 'size': 30, 'positions': position_data, 'clfs': clf_data_1},  'Sniffing': {'color': (155, 90, 10), 'size': 30, 'positions': position_data, 'clfs': clf_data_2}}
>>> PlottingMixin.make_path_plot(data=[x, y], colors=[(0, 255, 0), (255, 0, 0)], clf_attr=clf_data)
- make_probability_plot(data, style_attr, clf_name, fps, save_path)[source]
Make a single classifier probability plot png image.
- Parameters
:param str ot :param str save_path: Location to store output .png image.
- Example
>>> data = pd.Series(np.random.random((100, 1)).flatten())
>>> style_attr = {'width': 640, 'height': 480, 'font size': 10, 'line width': 6, 'color': 'blue', 'circle size': 20}
>>> clf_name='Attack'
>>> fps=10
>>> save_path = '/_test/frames/output/probability_plots/Together_1_final_frame.png'
>>> _ = self.make_probability_plot(data=data, style_attr=style_attr, clf_name=clf_name, fps=fps, save_path=save_path)
- static plot_bar_chart(df, x, y, error=None, x_label=None, y_label=None, title=None, fig_size=(10, 8), palette='magma', error_clr='grey', bar_alpha=1.0, dpi=600, orientation='vertical', y_min=0.0, y_max=None, save_path=None, as_svg=False)[source]
Create a bar chart from DataFrame columns.
Generates a bar chart with optional error bars, supporting both vertical and horizontal orientations. Uses seaborn for styling with customizable colors, transparency, and axis limits.
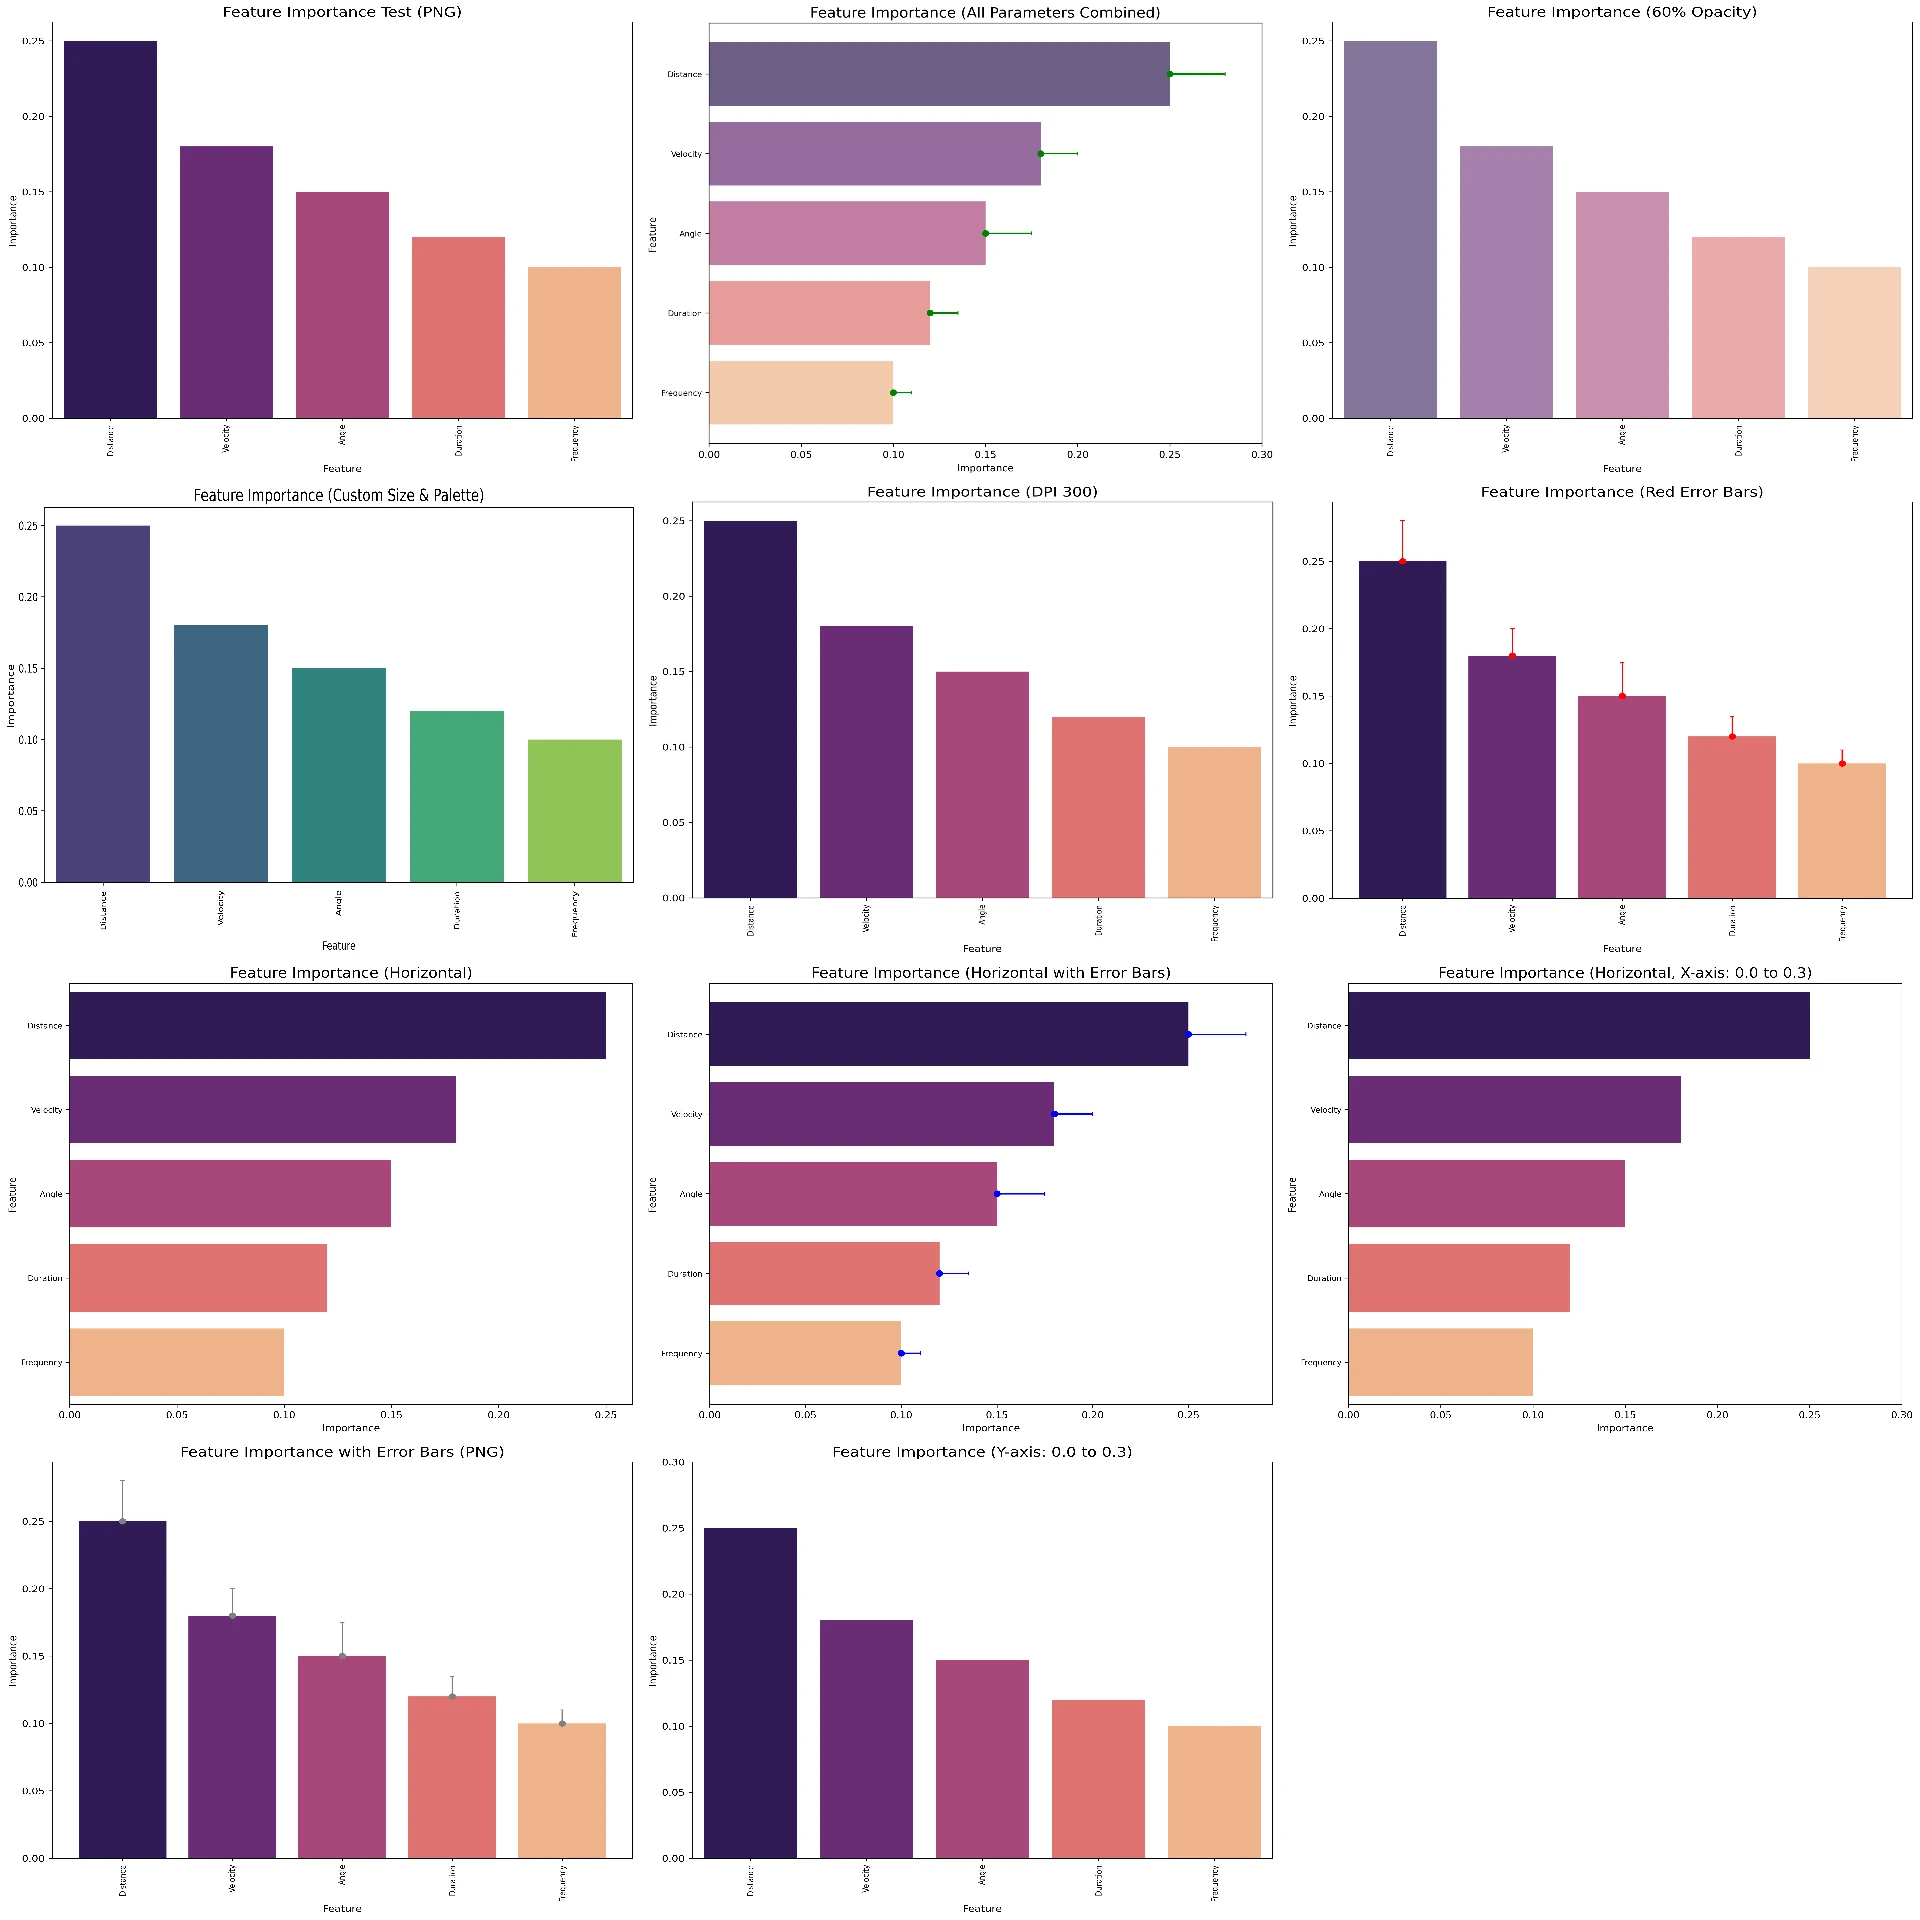
- Parameters
df (pd.DataFrame) – DataFrame containing the data to plot.
x (str) – Column name for x-axis categories.
y (str) – Column name for y-axis values (must be numeric).
error (Optional[str]) – Column name for error bar values. If None, no error bars are shown.
x_label (Optional[str]) – X-axis label. If None, no label is displayed.
y_label (Optional[str]) – Y-axis label. If None, no label is displayed.
title (Optional[str]) – Chart title. If None, no title is displayed.
fig_size (Tuple[int, int]) – Figure size (width, height) in inches. Default: (10, 8).
palette (str) – Seaborn color palette name. Default: ‘magma’.
error_clr (str) – Color name for error bars. Default: ‘grey’.
bar_alpha (float) – Bar transparency (0.0-1.0). Default: 1.0.
dpi (int) – Resolution for saved images. Default: 600.
orientation (Literal['vertical', 'horizontal']) – Bar orientation. Default: ‘vertical’.
y_min (float) – Minimum value for y-axis (or x-axis if horizontal). Default: 0.0.
y_max (Optional[float]) – Maximum value for y-axis (or x-axis if horizontal). If None, auto-scales. Default: None.
save_path (Optional[Union[str, os.PathLike]]) – Path to save the image. If None, returns matplotlib figure.
as_svg (bool) – If True, saves as SVG format. If False, saves as PNG. Default: False.
- Return Optional[matplotlib.figure.Figure]
Returns matplotlib figure if
save_pathis None, otherwise returns None.
- static plot_clf_cumcount(config_path, clf, data_dir=None, save_path=None, bouts=False, seconds=False)[source]
Generates and saves a cumulative count plot of a specified classifier’s occurrences over video frames or time.
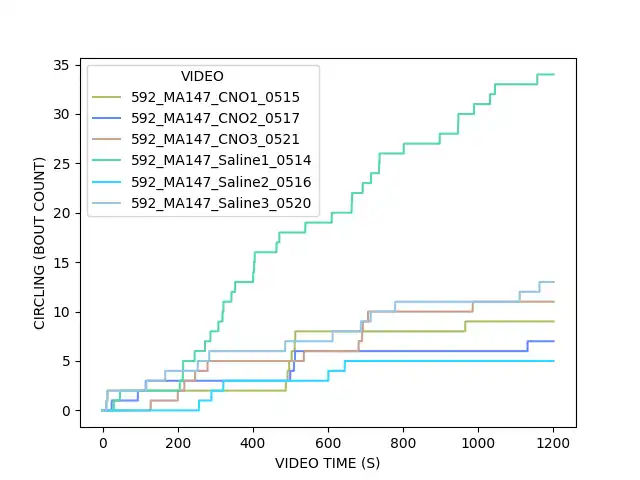
- Parameters
config_path (Union[str, os.PathLike]) – Path to the configuration file, which includes settings and paths for data processing and storage.
clf (str) – The classifier name (e.g., ‘CIRCLING’) for which to calculate cumulative counts.
data_dir (Optional[Union[str, os.PathLike]]) – Directory containing the log files to analyze. If not provided, the default path in the configuration is used.
save_path (Optional[Union[str, os.PathLike]]) – Destination path to save the plot image. If None, saves to the logs path in the configuration.
bouts (Optional[bool]) – If True, calculates the cumulative count in terms of detected bouts instead of time or frames.
seconds (Optional[bool]) – If True, calculates time in seconds rather than frames.
- Returns
None.
- Example
>>> plot_clf_cumcount(config_path=r"D: roubleshooting\mitra\project_folder\project_config.ini", clf='CIRCLING', data_dir=r'D: roubleshooting\mitra\project_folder\logs est', seconds=True, bouts=True)
- put_text(img, text, pos, font_size, font_thickness=2, font=2, font_path=None, text_color=(255, 255, 255), text_color_bg=(0, 0, 0), text_bg_alpha=0.8)[source]
Draws text on an image with a background color and transparency.
This method overlays text on an image at the specified position, with options for adjusting font size, thickness, background color, and background transparency. The text is drawn with an optional background rectangle that can have a specified transparency level to ensure readability over various image backgrounds.
- Parameters
img – The image on which the text is to be drawn. This is a NumPy array representing the image data.
text – The text string to be drawn on the image.
pos – The position (x, y) where the text will be placed on the image. The coordinates correspond to the bottom-left corner of the text.
font_size – The size of the font. When
font_pathis None, this is the cv2 scale factor multiplied by the font-specific base size. Whenfont_pathis passed, this is interpreted as the font PIXEL height.font_thickness – The thickness of the text strokes. It is an integer specifying the number of pixels for the thickness. Used only by the cv2 path (ignored when
font_pathis passed).font – The font type used to render the text. It corresponds to one of the predefined OpenCV Hershey font types (0-7). Ignored when
font_pathis passed.font_path – Optional path to a TrueType/OpenType (.ttf/.otf) font file. If passed, it takes precedence over
fontand the text is rendered with PIL using this font (e.g. for custom fonts such as Poppins). If None, the cv2 Hersheyfontis used.text_color – The color of the text in RGB format. By default, the text color is white.
text_color_bg – The background color for the text in RGB format. By default, the background color is black.
text_bg_alpha – The transparency level of the background rectangle. A value between 0 and 1, where 0 is fully transparent and 1 is fully opaque.
- Returns
The image with the overlaid text and background rectangle.
- remove_a_folder(folder_dir)[source]
Helper to remove a directory, use for cleaning up smaller multiprocessed videos following concat
- static rotate_img(img, right)[source]
Flip a color image 90 degrees to the left or right
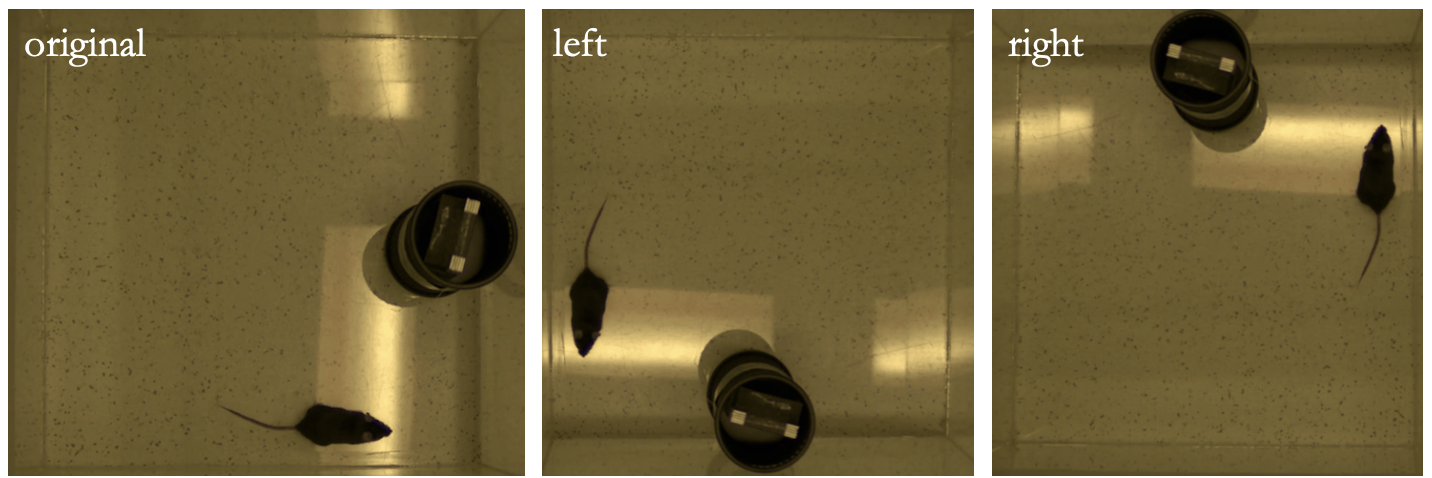
- Parameters
img (np.ndarray) – Input image as numpy array in uint8 format.
right (bool) – If True, flips to the right. If False, flips to the left.
- Returns
The rotated image as a numpy array of uint8 format.
- Example
>>> img = cv2.imread('/Users/simon/Desktop/test.png')
>>> rotated_img = PlottingMixin.rotate_img(img=img, right=False)
- split_and_group_df(df, splits, include_row_index=False, include_split_order=True)[source]
Helper to split a dataframe for multiprocessing. If include_split_order, then include the group number in split data as a column. If include_row_index, includes a column representing the row index in the array, which can be helpful for knowing the frame indexes while multiprocessing videos. Returns split data and approximations of number of observations per split.
Light-/Dark-box plotting
- class simba.plotting.light_dark_box_plotter.LightDarkBoxPlotter(video_dir, data_dir, save_dir, body_part, fps, threshold=0.01, minimum_episode_duration=1e-15, core_cnt=- 1)[source]
Bases:
objectGenerate annotated videos visualizing behavior episodes in a light/dark box setup.
See also
For light/dark box data analysis, see
simba.data_processors.light_dark_box_analyzer.LightDarkBoxAnalyzer().- Parameters
data_dir ((str or os.PathLike)) – Directory containing pose estimation CSV files.
video_dir ((str or os.PathLike)) – Directory containing video files corresponding with the names of the CSVs in
data_dir.save_dir ((str or os.PathLike)) – Output directory to save the resulting annotated videos.
body_part ((str)) – The name of the body part used to determine position and behavior.
:param (int or float) fps : Frames per second of the videos (used for timing episodes). :param (float) threshold: Threshold value for light/dark classification (between 0.0 and 1.0). :param (float) minimum_episode_duration : Minimum duration (in seconds) for an episode to be considered valid. :param (int) core_cnt: Number of CPU cores to use for parallel processing. If -1, uses all available cores.
- References
- 1
For discussion about the development, see - GitHub issue 446.